When it comes to understanding and analyzing electrical power systems, having an accurate and concise representation is crucial. Power system engineers rely on different methods to visually depict the components and behavior of these complex systems. In this article, we will delve into the three commonly used methods of representing power systems: the One Line Diagram, the Impedance Diagram, and the Reactance Diagram. These methods provide invaluable insights into the relationships between various components and aid in designing, fault analysis, and maintenance of power systems. So, let’s explore each of these methods in detail and discover how they contribute to a better understanding of power systems.
There are several methods used to represent a power system. The three commonly used methods are:
1. One Line Diagram
The one-line diagram is a symbolic representation of an electrical power system. It simplifies a three-phase power system into a single-phase system. In a single-phase system, there is a phase wire and a neutral wire. To create an equivalent circuit, we use a symbolic representation as shown in the following figure:


In this diagram, three generators (G1, G2, and G3) are grounded separately through a reactor. The generators are connected to the bus bar through circuit breakers, and the step-up transformers are connected to the transmission line T1 through circuit breakers.
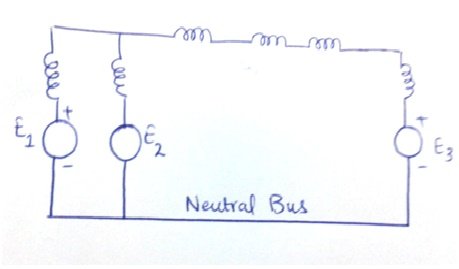
2. Impedance Diagram
An impedance diagram represents electrical components in terms of impedances. We can convert the one-line diagram into an impedance diagram, as shown in the following figure:

In this diagram:
- Load impedances are represented by RL.
- The current limiting impedances between generators and grounds are omitted.
- The shunt impedances of transformers are omitted.
- The transmission line is represented by a π circuit.
3. Reactance Diagram
A reactance diagram represents all components of a power system using reactances, neglecting resistance. The reactance diagram is similar to the impedance diagram, with the exception that loads of rotating machines are usually neglected as they have no significant effect on line currents during a fault. Synchronous motor loads are always considered during fault calculations, but the generated EMF is considered in short circuit currents. Induction motors are neglected when finding currents. The impedance diagram can be converted into a reactance diagram, as shown in the following figure:
By using these different diagrams, power system engineers can effectively represent and analyze the electrical components and behavior of a power system.
Conclusion
In conclusion, understanding and analyzing electrical power systems require accurate and concise representations. The three commonly used methods of representing power systems, namely the One Line Diagram, the Impedance Diagram, and the Reactance Diagram, provide invaluable insights into the relationships between various components. These methods aid in designing, fault analysis, and maintenance of power systems. By utilizing these different diagrams, power system engineers can effectively depict and analyze the electrical components and behavior of a power system. Having a thorough understanding of these methods contributes to a better understanding and management of power systems as a whole.
Related content: