In this tutorial, we will learn about the debugging tools in LabVIEW. How to use them and what their benefits are in LabView. At the start, we have provided an introduction, including an explanation of debugging along with the debugging tool. Lastly, we will discuss the purpose of the debugging tool in LabView and how to use it. After that, we will design a VI explaining the use of debugging tools. Which explains the concept of debugging tools more clearly. At the end of the tutorial, we have provided an exercise for you to do on your own, and in the next tutorials, we will assume that you have done those exercises and not explain the concept regarding them.
Introduction to Debugging and Debugging Tools in LabVIEW
In computer programming and engineering, the definition of debugging is a multistep process that involves identifying a problem. The debugging not only determines the problem but also isolates the source of the problem and corrects it. It also includes finding a method to correct the problem or error in a program. Finally, testing the correction of the program and making sure that it works properly is the final step of the debugging procedure.
A computer program that tests the working of and removes errors from other computer programs is known as a debugger or debugging tool.

In LabVIEW software, a powerful debugging tool is already available. This helps identify problem areas and determine the exact location of errors in our code. It also guides us to what the problem is or error in our VI is so we can correct it. Lastly, we can make specific changes to our VI to work around any errors. LabView can help us identify and troubleshoot all types of errors in our program, i.e., those that prevent the program from running and also those that generate erroneous results at the output after running the program.
If the run arrow of the LabVIEW block diagram window is broken, this implies that the program contains an error or multiple errors. By clicking on the arrow, LabVIEW will display the error list, because of which the arrow is broken. From the types of bugs we discussed above, the later one is harder to track down and debug. Fortunately, LabView has numerous tools, i.e., highlight execution, through which we can actually watch the code as it executes, which makes the process much easier.
How to Debug Programs in LabVIEW with Examples
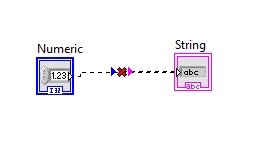
We will now use a VI to explain the workings of the debugging tools in LabView. Create a VI as we have been doing since Tutorial 1 and save it for future use by pressing <Ctrl+S>. To understand the use of a debugging tool, we must first create a program with errors in it. For the sake of it, create a simple control indicator VI and connect them. Make sure that the control and indicator are of different types, as shown in the figure below.
When there is an error in the VI, we will not be able to run it. This is similar to the case with any other text-based programming language. Even the run arrow on the block diagram window will not remain solid if the VI has errors in it. It converts into a broken arrow, as shown in the figure below.
List of Errors
Now, if we hover over the arrow, instead of running, it will show the list of errors, which implies that the VI is erroneous. By clicking on the run arrow, it will now show us a dialog box displaying all the errors currently present in the VI, as shown in the figure below.
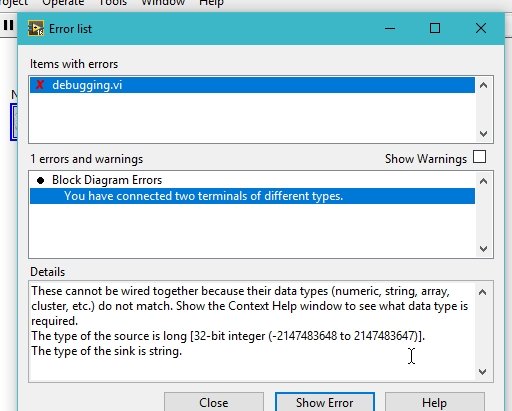
This window will show all the errors currently present in a VI. In the above VI, only one error is present, so the window shows only one error. We can see the error in the block diagram or front panel by clicking on the show error button in the error list window, as shown in the figure below.

This will highlight the error in the block diagram, as shown in the figure below.

Now if we change the type of the indicator from string data type to numeric, we can see that this will remove the error, as shown in the figure below.

The arrow will also be changed from broken to solid. Now, we can run the program as shown in the figure below.

Sample VI with Errors
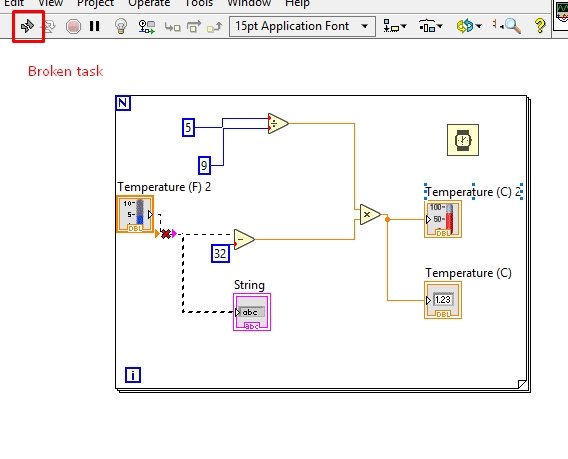
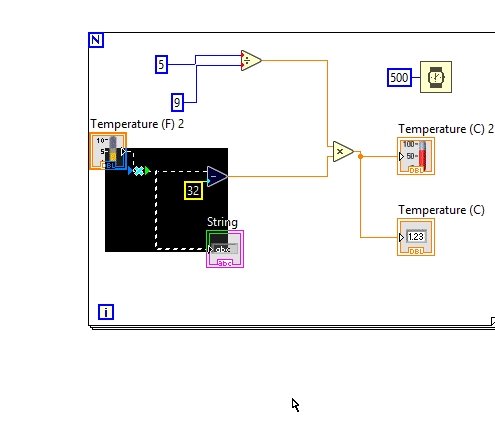
Let’s consider another VI as an example, as shown in the figure below. This VI already has errors in it, and our task here is to resolve the errors in the VI using the debugging method we just discussed. See the figure below.
In the above VI, the broken arrow shows that there are errors in the VI; clicking on the arrow will display the list of errors as shown in the figure below.

Error Indication
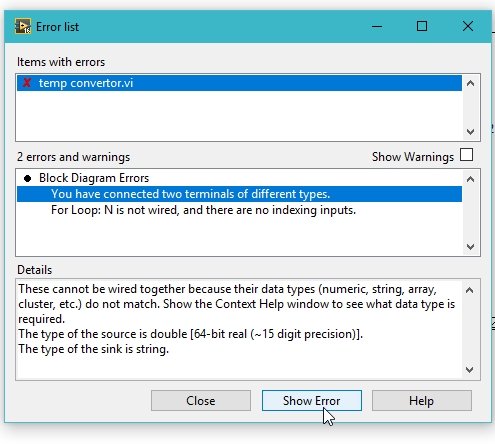
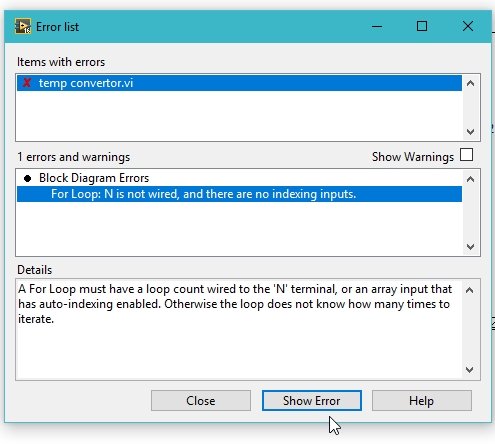
This window shows that there are 3 errors in the VI, and when we select an error, as we have in this case, and click on show error, the VI will show where the error is located. This window also describes the problem at the point that needs to be fixed; refer to the figure below.

This indicated that our wait is not given a time or constant for which it has to wait before moving to the next iteration. Create a constant here and specify a value for it. Now move to the next error, which says that two different data types are connected as shown in the figure below.
Clicking on the show error button will display the error in the block diagram as shown in the figure below.
We have connected a double-type control to a string-type indicator; change the indicator type to double, and the error will be removed. Now let’s move forward to the third error, which states that the for loop termination condition is not specified as shown in the figure below.
The number of loops to be covered by the VI before termination of the code is not specified in the VI. If we click on the show error button, it will display the exact location of the error as shown in the figure below.

Non-Erroneous VI
Specify the number of iterations, i.e., N, by creating a constant with N. After this, specify an integer in it, and the third error will also be removed. The VI with all the errors removed from it is shown in the figure below.
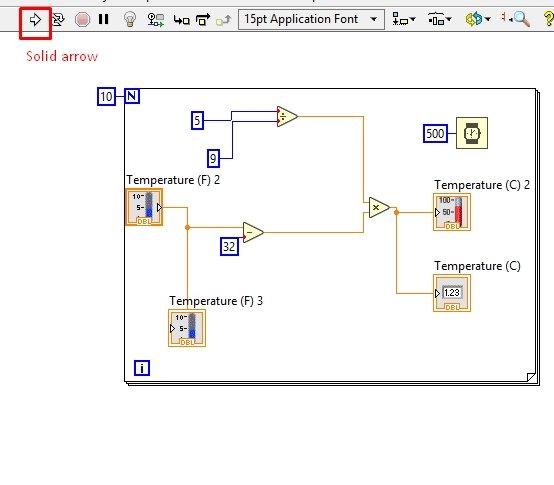
We can see from the above figure that the arrow has changed from the broken one to the solid one. This indicates that there are no errors remaining in it. We can also use the highlighting tool to see the flow of data in the VI.
Exercise
- Turn on the highlight execution and run the VI from which we just removed the errors (temp_conv.vi). Now, see the flow of data in the VI as we have done in the tutorial explaining dataflow.
Conclusion
In conclusion, this tutorial has provided a comprehensive overview of debugging tools in LabVIEW. This tutorial also covers a step-by-step procedure for implementing debugging tools in your VI program. We have also explained the list of errors provided by LabVIEW that cause issues while running the program. You can utilize this to debug any LabVIEW VI program that is causing errors while running. At last, we have also included an exercise so you can completely grasp the concept of debugging in LabVIEW. We hope that this tutorial has been helpful in expanding your knowledge.
You may also like to read:
- Simulation and design of Three phase Rectifier in Simulink MATLAB
- Reconnect ESP32 to WiFi after Lost Connection (Solved)
- ESP32-CAM Image Classification using Machine Learning
- Micro SD Card Module with ESP8266 NodeMCU
- Solar NiCad battery charger
This concludes today’s article. If you face any issues or difficulties, let us know in the comment section below.