In this tutorial, we will learn to monitor heart rate using a pulse sensor (SEN-11574) and ESP8266 NodeMCU. Firstly, We will discuss the introduction, pinout, working, and connection diagram of the pulse sensor (SEN-11574) with ESP8266 NodeMCU. After that, we will three examples such as controlling LED with pulse rate, plotting data on serial monitor, and visualizing pulse sensor data with processing library. We can use this sensor to measure the heart beat rate (BPM). Additionally, by using a processing visualizer library we will show BPM and IBI in real time in an interactive way.

We have a similar guide with Arduino and ESP32:
SEN-11574 Pulse Sensor Introduction
The SEN-11574 pulse sensor is mainly used for sensing heartbeat rate. Normally it is a very difficult task to measure the exact heartbeat rate, but this has become so much easy with the help of this pulse sensor amped. If we talk about heartbeat, then heart beat is a periodic signal that is produced by any software or hardware system for giving intimation to normal of working of any system. For measuring this periodic intimation signal, many sensors have been used currently in the market but here we shall only talk about SEN-11574 pulse sensor amped. This is basically plugged and play heartbeat sensor and can be used by athletes, game developers, and students in their hardware projects. It is easily available in the market or online shops.
A simple heartbeat pulse sensor is shown below:
It has many applications in our daily life. Some common ones include using the sensor in exercise machines for heart beat measurement during workout and heart beat meter for local use at home.
Pulse Sensor Circuit
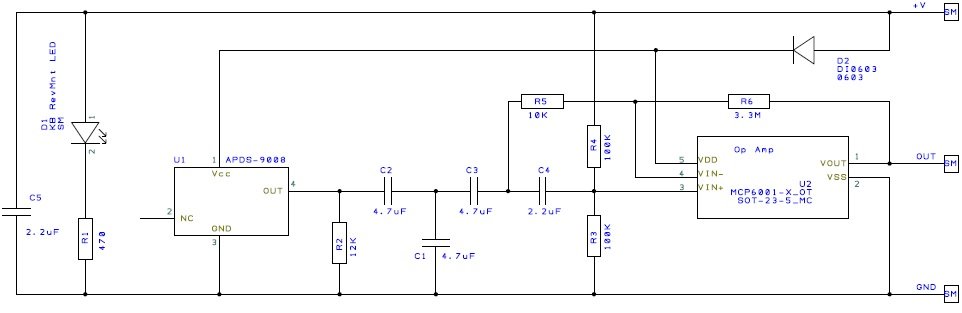
The following figure shows the internal circuit diagram of a pulse sensor. It consists of an optical heart beat sensor, an amplification circuit, and a noise cancellation circuit.
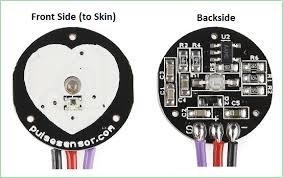
The front side of the pulse sensor, where the heart shape is drawn, consists of a central LED. This is a hole from where Kingbright’s reverse installed green LED glows and helps the sensor for detecting heartbeat rate. Just under the LED is a photodetector sensor. Besides this, there is another circuitry below the LED. This circuitry is called noise elimination circuitry. It is used for eliminating the noise to enhance the reading of the heart rate pulse sensor.

Pinout
This pulse sensor consists of three pins.
- First one is the GND pin which is used for supplying ground to this sensor and it is connected to source ground pin.
- The middle pin is the VCC pin which is used to supply power to the sensor. This sensor is powered on at almost 3.3V to 5V dc voltages.
- Similarly, the last one is the A0 pin which is an analogue pin and it is used for receiving analogue signal. The sensor gives the output in the form of voltage. We need to measure this voltage waveform and extract heart beat rate out of this waveform.this sensor also consists of a central LED. This LED helps the sensor for detecting heartbeat rate. Beside this, there is another circuitry below LED and this circuitry is called noise elimination circuitry. This circuitry is used for eliminating the noise which effects on the reading of the heart rate pulse sensor.
The pin configuration of this heart rate sensor is shown in the picture below:

Specifications
The table below shows some key specifications of the SEN-11574 sensor.
| Operating Temperature | -40°C to +80°C |
| Input Voltage (VCC) | 3V to 5.5V |
| Output Voltage | 0.3V to VCC |
| Supply Current | 3mA to 4mA |
| Dimensions (L x W) | 15.8mm |
How Pulse Sensor Works?
The working principle of this heartbeat rate sensor is very simple. If we talk about heartbeat rate, then heartbeat rate is the ratio of time between two consecutive heartbeats. Similarly, when the human blood is circulated in human body then this blood is squeezed in capillary tissues. As a result, the volume of capillary tissues is increased but this volume is decreased after each heartbeat. This change in volume of capillary tissues affects the LED light of heart rate pulse sensor, which transmits light after each heartbeat. This change in light is very small but this can be measured by connecting any controller with this pulse sensor. This means the LED light which has every pulse sensor helps for measuring pulse rate.
The working of this sensor could be checked by placing a human finger in front of this pulse sensor. When a finger is placed in front of this pulse sensor then the reflection of LED light is changed based on the volume of blood change inside capillary vessels. This means during the heartbeat the volume of blood in capillary vessels will be high and then will be low after each heartbeat. So, by changing this volume the LED light is changed. This change in of LED light measures the heartbeat rate of a finger. This phenomenon is known as “Photoplethysmogram.”
Interfacing Pulse Sensor with ESP8266 NodeMCU
We will require the following components for this tutorial.
Required Components:
- ESP8266 NodeMCU board
- SEN-11574 pulse sensor
- Connecting Wires
As we know already that the pulse sensor has three pins that we have to connect with our ESP8266. These include the GND, VCC, and signal pin.
Follow the table and the schematic diagram below to successfully connect your circuit.
| ESP8266 NodeMCU | SEN-11574 PulseSensor |
|---|---|
| GND | GND |
| A0 | A0 |
| 5V | VCC |
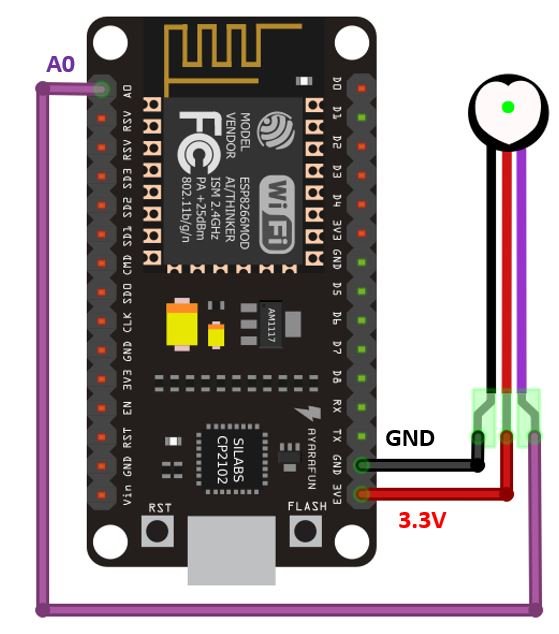
As the pulse sensor requires an operating voltage in the range of 3.3-5V hence we will connect the VCC terminal of the sensor with 3.3V pin of the ESP8266 board. Both the grounds will be in common. Additionally, the analog signal pin of the sensor will be connected with the A0 of the ESP8266 NodeMCU board.
Installing ESP8266 and Pulse Sensor Arduino Library
We will use Arduino IDE to program our ESP8266 development board. Thus, you should have the latest version of Arduino IDE. Additionally, you also need to install the ESP8266 plugin.
If your IDE does not have the plugin installed you can visit the link below: Installing ESP8266 library in Arduino IDE
Installing Pulse Sensor Library
Open Arduino IDE and click on Sketch > Library > Manage Libraries
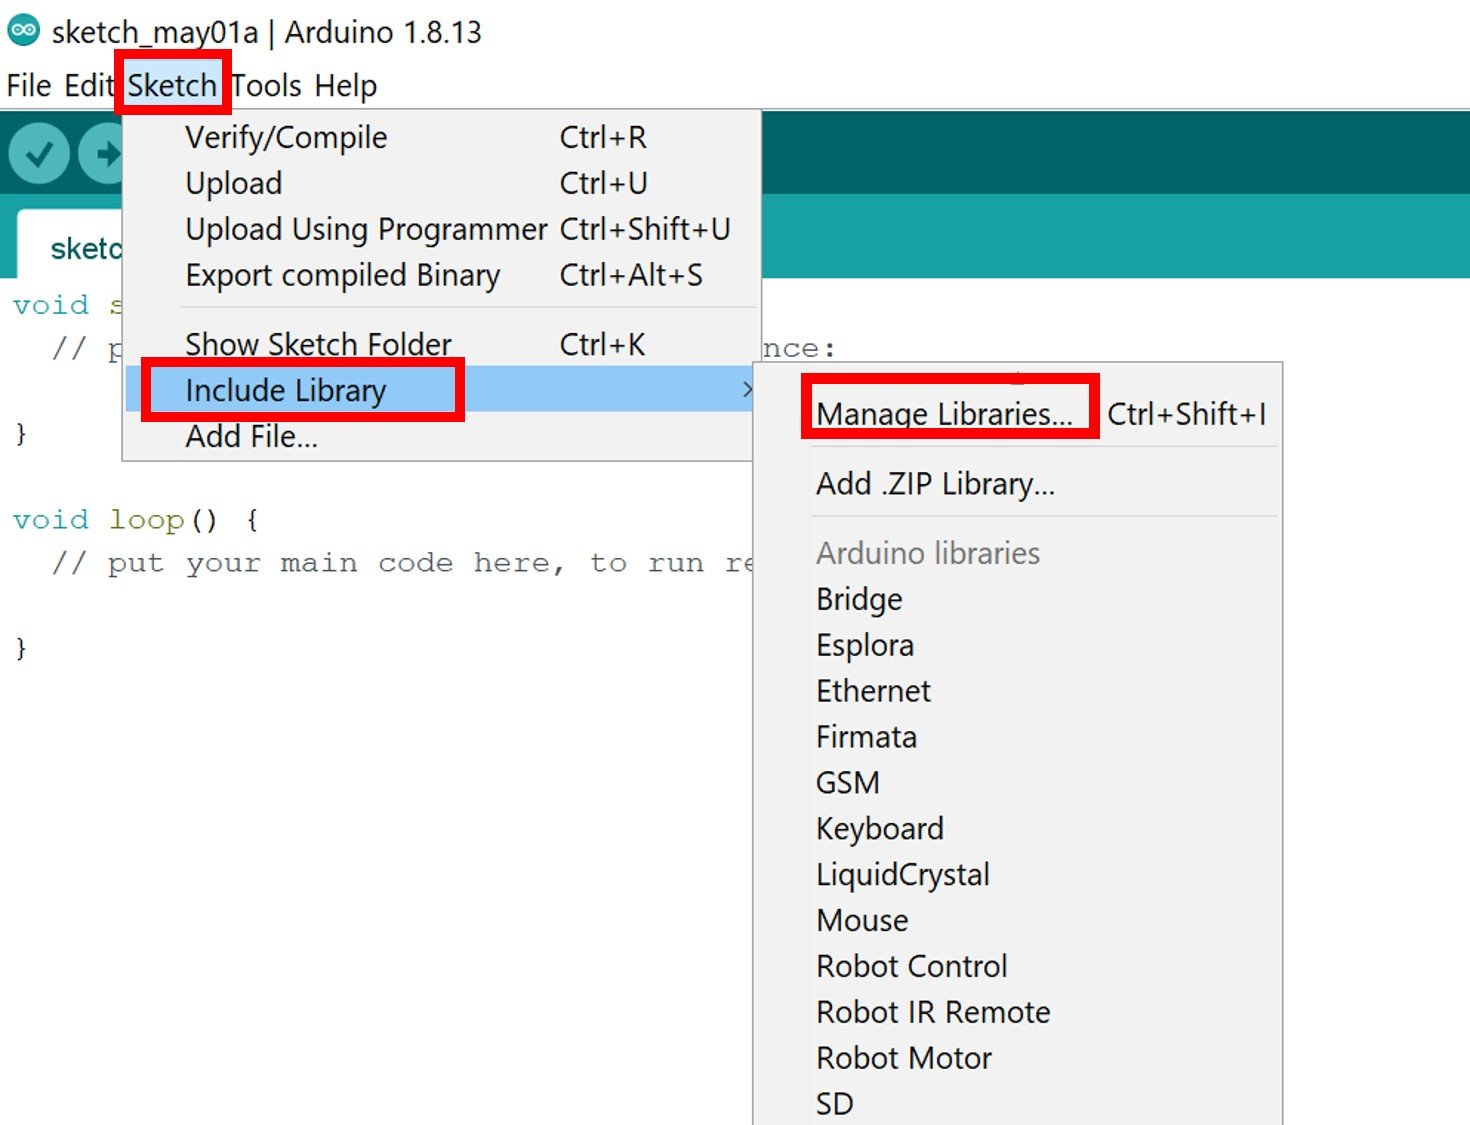
The following window will open up.
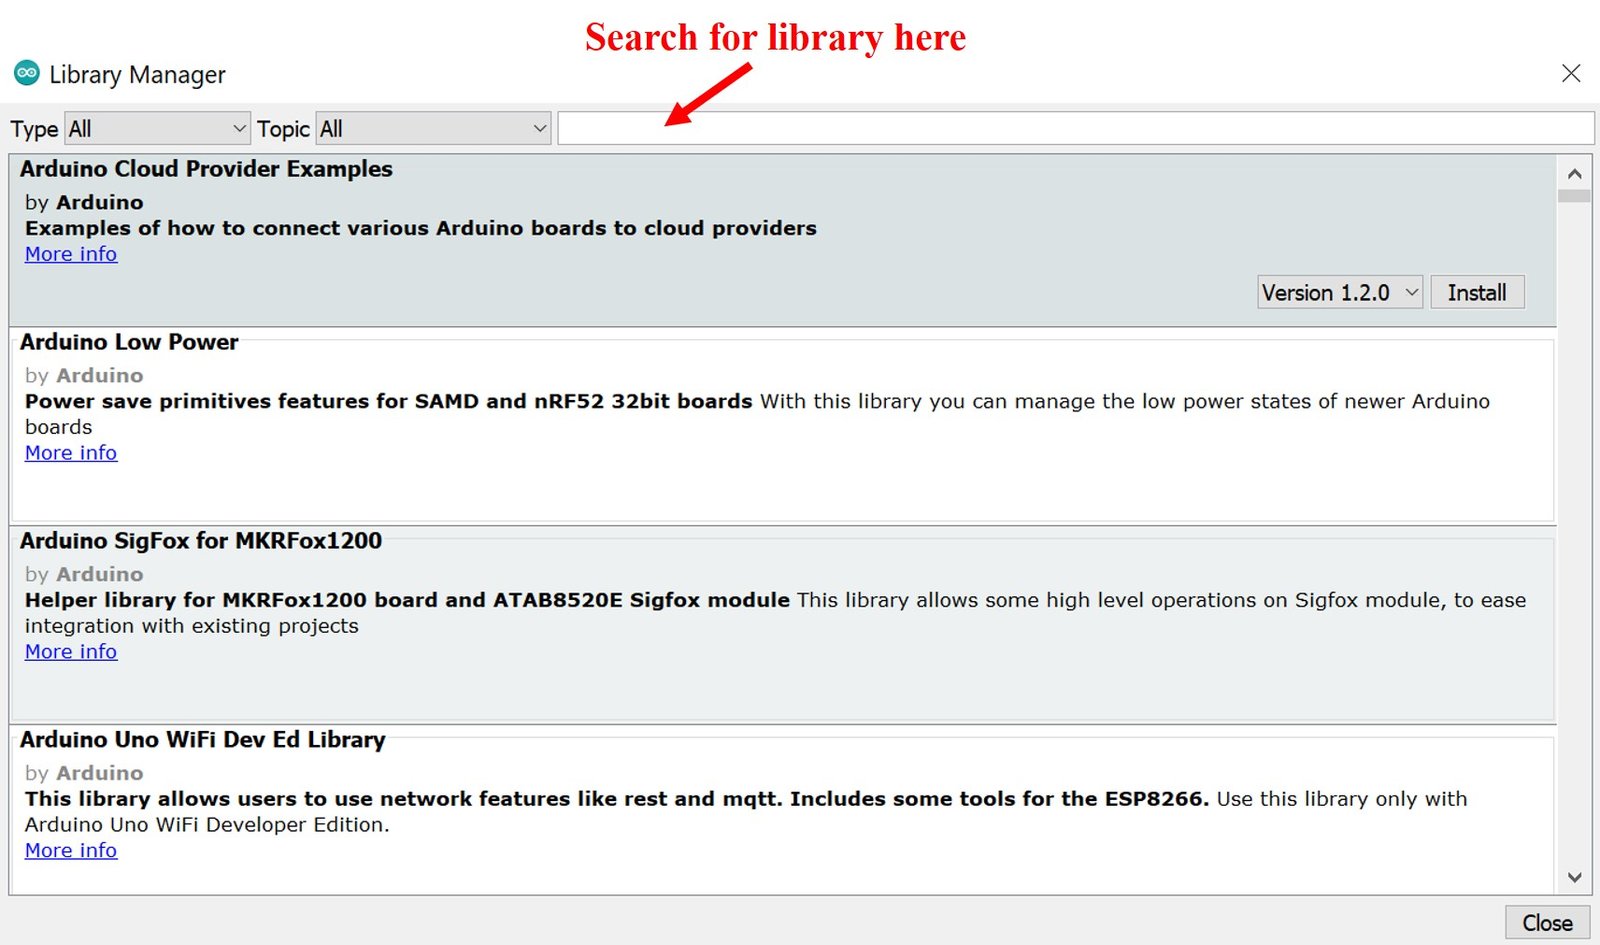
Type ‘pulsesensor’ in the search bar and press enter. Install the latest version of the library.

After installation of the library, restart your IDE.
ESP8266 NodeMCU with Pulse Sensor: Example Sketches
In this section, we will show you how to use example sketches available in the Arduino IDE for PulseSensor Playground library that we just installed. We will look at different examples to effectively learn how to use the pulse sensor with our ESP8266 NodeMCU board.
Detect Heart Rate with Pulse Sensor and ESP8266 NodeMCU
In this section, we will see how to detect heart rate with ESP8266 NodeMCU and pulse sensor. We will control an onboard LED of ESP8266 NodeMCU with heart rate.
Open your Arduino IDE and go to File > Examples > PulseSensor Playground > GettingStartedProject.
The following program code will open. This example sketch will blink the built-in LED of ESP8266 in synchronization with your heart beat when you hold the sensor in between your fingers.
/*  PulseSensor Starter Project and Signal Tester
 *  The Best Way to Get Started  With, or See the Raw Signal of, your PulseSensor.com™ & Arduino.
 *
 *  Here is a link to the tutorial
 *  https://pulsesensor.com/pages/code-and-guide
 *
 *  WATCH ME (Tutorial Video):
 *  https://www.youtube.com/watch?v=RbB8NSRa5X4
 *
 *
-------------------------------------------------------------
1) This shows a live human Heartbeat Pulse.
2) Live visualization in Arduino's Cool "Serial Plotter".
3) Blink an LED on each Heartbeat.
4) This is the direct Pulse Sensor's Signal.
5) A great first-step in troubleshooting your circuit and connections.
6) "Human-readable" code that is newbie friendly."

*/


//  Variables
int PulseSensorPurplePin = 0;        // Pulse Sensor PURPLE WIRE connected to ANALOG PIN 0
int LED13 = 13;   //  The on-board Arduion LED


int Signal;                // holds the incoming raw data. Signal value can range from 0-1024
int Threshold = 550;            // Determine which Signal to "count as a beat", and which to ingore.


// The SetUp Function:
void setup() {
  pinMode(LED13,OUTPUT);         // pin that will blink to your heartbeat!
   Serial.begin(9600);         // Set's up Serial Communication at certain speed.

}

// The Main Loop Function
void loop() {

  Signal = analogRead(PulseSensorPurplePin);  // Read the PulseSensor's value.
                                              // Assign this value to the "Signal" variable.

   Serial.println(Signal);                    // Send the Signal value to Serial Plotter.


   if(Signal > Threshold){                          // If the signal is above "550", then "turn-on" Arduino's on-Board LED.
     digitalWrite(LED13,HIGH);
   } else {
     digitalWrite(LED13,LOW);                //  Else, the sigal must be below "550", so "turn-off" this LED.
   }


delay(10);


}
Modifications to the sketch
The sketch above works well with Arduino board. We will have to modify two lines in this sketch for it to effectively work with our ESP8266 board.
Firstly, the built-in LED of ESP8266 is connected with GPIO2 so change the ‘LED13’ variable to 2.
int LED13 = 2; Secondly, for ESP8266, the onboard LED works on an opposite logic as compared to Arduino. To turn the onboard LED ON, a low signal is sent, and to turn it OFF, a high signal is sent. This is the opposite in the case of Arduino. Thus, reverse the second arguments in the digitalWrite() function by specifying HIGH instead of LOW and vice versa.
if(Signal > Threshold){
     digitalWrite(LED13,LOW);
   } else {
     digitalWrite(LED13,HIGH);
   }
How the Code Works?
Now let us understand how the code is working.
Firstly, some variables are defined that include the GPIO through which the sensor’s signal pin is connected with. It is A0. Next, the built-in LED’s GPIO pin number is stated. It is GPIO2. The signal variable of data type integer holds the ADC data and the threshold variable will help in differentiating a valid heart beat. By default it is set to 550.
int PulseSensorPurplePin = 0;
int LED13 = 2;
int Signal;
int Threshold = 550;
setup()
Inside the setup() function, the serial connection is opened at a baud rate of 9600.
Serial.begin(9600); Using the pinMode() function, the built-in LED will be configured as an output pin.
pinMode(LED13,OUTPUT); loop()
Inside the loop() function, first by using analogRead() on the A0 pin the ADC signal data will get saved in the ‘Signal’ variable. This is the same variable that we defined earlier.
Signal = analogRead(PulseSensorPurplePin);Next, print this value in the serial monitor/serial plotter for debugging purposes and can also be used to set the threshold value.
Serial.println(Signal)The following lines of code will check whether the value saved in the signal variable is greater than the set threshold value. If it is, then turn the built-in LED ON. Otherwise, turn it OFF.
 if(Signal > Threshold){
     digitalWrite(LED13,LOW);
   } else {
     digitalWrite(LED13,HIGH);
   }
delay(10);
Demonstration
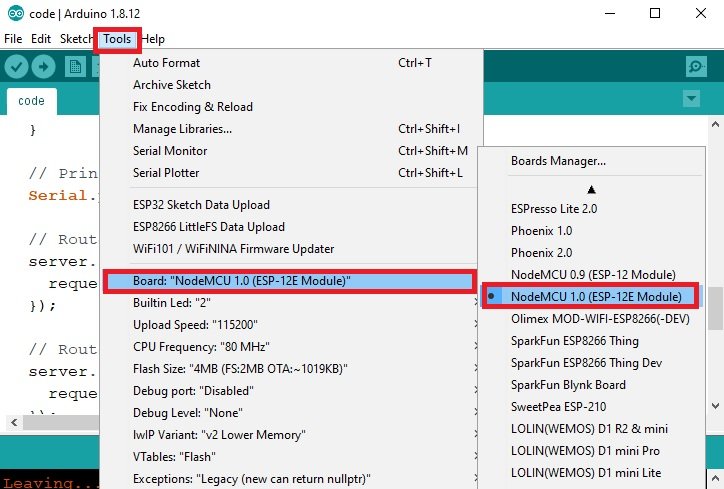
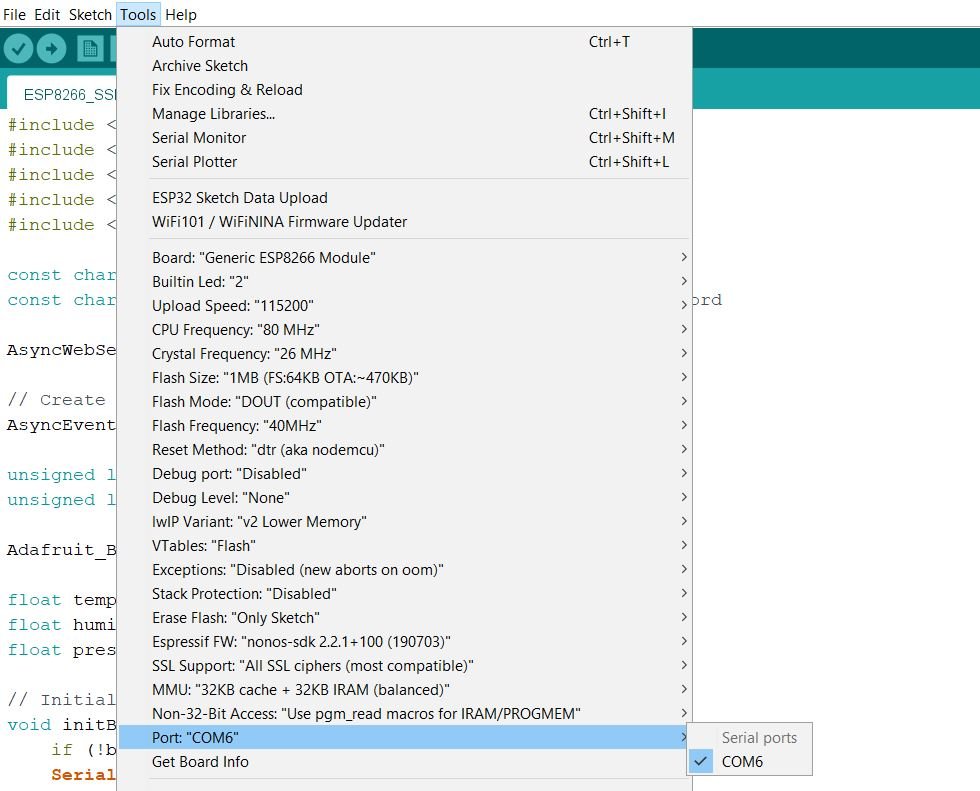
To see the demonstration of the above code, upload the code to ESP8266. But, before uploading the code, make sure to select the ESP8266 board from Tools > Board and also select the correct COM port to which the board is connected from Tools > Port.
Once the code is uploaded to board, hold the sensor in between your fingers. Do not hold it very tightly or very lightly. Make sure you apply normal pressure while holding the sensor. This will result in a better clean signal.
The built-in LED of ESP8266 will start blinking with your heart beat. If for some reason the built-in LED is not blinking properly change the threshold value. The threshold value can take values from 0-1023.
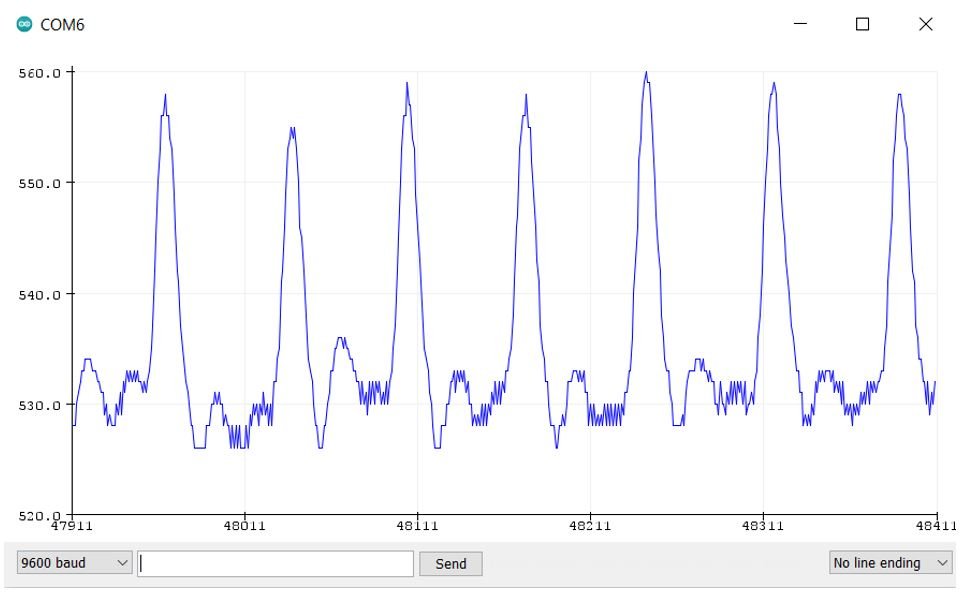
ESP8266 NodeMCU Plotting Heart Beat Signal
Now, we will plot the same signal retrieved from the pulse sensor through the Serial Plotter. We are using the same sketch as above. This time however, we will show you a graph of the user’s pulse.
Once the code is uploaded to the ESP8266 board, hold the sensor in between your fingers. Do not hold it very tightly or very lightly. Make sure you apply normal pressure while holding the sensor. This will result in a better clean signal.
Now go to Tools > Serial Plotter and set its baud rate to 9600. On the serial plotter you will be able to see the signal take various values within a certain range. After a while, the signal will stabilize and you will get a clearer heart beat signal. This is the signal that we obtained.
Plot Hear Rate in Real time with Processing Visualization Application
Before proceeding further, make sure you have the latest version of Processing installed on your system. Download it from here (https://processing.org/download)
Now we will use the processing visualization application to view the user’s heart beat, their BPM, and IBI in real-time. This will be achieved inside the software where it acquires the signal data from the programmed ESP8266 board connected with the pulse sensor.
In order to use this tool, we just need the PulseSensor_BPM_Alternative Arduino sketch (available in the PulseSensor Playground library examples) uploaded to our development board. No additional programming or modifications are required. Follow the steps in the given order to successfully set up the application and view the signal.
Open your Arduino IDE and go to File > Examples > PulseSensor Playground > PulseSensor_BPM_Alternative. The following example sketch will open.
Do not use this BPM monitor for medical purposes as it is not very accurate.
/*
   Sketch to handle each sample read from a PulseSensor.
   Typically used when you don't want to use interrupts
   to read PulseSensor voltages.

   Here is a link to the tutorial that discusses this code
   https://pulsesensor.com/pages/getting-advanced

   Copyright World Famous Electronics LLC - see LICENSE
   Contributors:
     Joel Murphy, https://pulsesensor.com
     Yury Gitman, https://pulsesensor.com
     Bradford Needham, @bneedhamia, https://bluepapertech.com

   Licensed under the MIT License, a copy of which
   should have been included with this software.

   This software is not intended for medical use.
*/

/*
   Every Sketch that uses the PulseSensor Playground must
   define USE_ARDUINO_INTERRUPTS before including PulseSensorPlayground.h.
   Here, #define USE_ARDUINO_INTERRUPTS false tells the library to
   not use interrupts to read data from the PulseSensor.

   If you want to use interrupts, simply change the line below
   to read:
     #define USE_ARDUINO_INTERRUPTS true

   Set US_PS_INTERRUPTS to false if either
   1) Your Arduino platform's interrupts aren't yet supported
   by PulseSensor Playground, or
   2) You don't wish to use interrupts because of the side effects.

   NOTE: if US_PS_INTERRUPTS is false, your Sketch must
   call pulse.sawNewSample() at least once every 2 milliseconds
   to accurately read the PulseSensor signal.
*/
#define USE_ARDUINO_INTERRUPTS false
#include <PulseSensorPlayground.h>

/*
   The format of our output.

   Set this to PROCESSING_VISUALIZER if you're going to run
    the Processing Visualizer Sketch.
    See https://github.com/WorldFamousElectronics/PulseSensor_Amped_Processing_Visualizer

   Set this to SERIAL_PLOTTER if you're going to run
    the Arduino IDE's Serial Plotter.
*/
const int OUTPUT_TYPE = PROCESSING_VISUALIZER;

/*
   Pinout:
     PULSE_INPUT = Analog Input. Connected to the pulse sensor
      purple (signal) wire.
     PULSE_BLINK = digital Output. Connected to an LED (and 220 ohm resistor)
      that will flash on each detected pulse.
     PULSE_FADE = digital Output. PWM pin onnected to an LED (and resistor)
      that will smoothly fade with each pulse.
      NOTE: PULSE_FADE must be a pin that supports PWM.
       If USE_INTERRUPTS is true, Do not use pin 9 or 10 for PULSE_FADE,
       because those pins' PWM interferes with the sample timer.
*/
const int PULSE_INPUT = A0;
const int PULSE_BLINK = 13;    // Pin 13 is the on-board LED
const int PULSE_FADE = 5;
const int THRESHOLD = 550;   // Adjust this number to avoid noise when idle

/*
   samplesUntilReport = the number of samples remaining to read
   until we want to report a sample over the serial connection.

   We want to report a sample value over the serial port
   only once every 20 milliseconds (10 samples) to avoid
   doing Serial output faster than the Arduino can send.
*/
byte samplesUntilReport;
const byte SAMPLES_PER_SERIAL_SAMPLE = 10;

/*
   All the PulseSensor Playground functions.
*/
PulseSensorPlayground pulseSensor;

void setup() {
  /*
     Use 115200 baud because that's what the Processing Sketch expects to read,
     and because that speed provides about 11 bytes per millisecond.

     If we used a slower baud rate, we'd likely write bytes faster than
     they can be transmitted, which would mess up the timing
     of readSensor() calls, which would make the pulse measurement
     not work properly.
  */
  Serial.begin(115200);

  // Configure the PulseSensor manager.
  pulseSensor.analogInput(PULSE_INPUT);
  pulseSensor.blinkOnPulse(PULSE_BLINK);
  pulseSensor.fadeOnPulse(PULSE_FADE);

  pulseSensor.setSerial(Serial);
  pulseSensor.setOutputType(OUTPUT_TYPE);
  pulseSensor.setThreshold(THRESHOLD);

  // Skip the first SAMPLES_PER_SERIAL_SAMPLE in the loop().
  samplesUntilReport = SAMPLES_PER_SERIAL_SAMPLE;

  // Now that everything is ready, start reading the PulseSensor signal.
  if (!pulseSensor.begin()) {
    /*
       PulseSensor initialization failed,
       likely because our Arduino platform interrupts
       aren't supported yet.

       If your Sketch hangs here, try changing USE_PS_INTERRUPT to false.
    */
    for(;;) {
      // Flash the led to show things didn't work.
      digitalWrite(PULSE_BLINK, LOW);
      delay(50);
      digitalWrite(PULSE_BLINK, HIGH);
      delay(50);
    }
  }
}

void loop() {

  /*
     See if a sample is ready from the PulseSensor.

     If USE_INTERRUPTS is true, the PulseSensor Playground
     will automatically read and process samples from
     the PulseSensor.

     If USE_INTERRUPTS is false, this call to sawNewSample()
     will, if enough time has passed, read and process a
     sample (analog voltage) from the PulseSensor.
  */
  if (pulseSensor.sawNewSample()) {
    /*
       Every so often, send the latest Sample.
       We don't print every sample, because our baud rate
       won't support that much I/O.
    */
    if (--samplesUntilReport == (byte) 0) {
      samplesUntilReport = SAMPLES_PER_SERIAL_SAMPLE;

      pulseSensor.outputSample();

      /*
         At about the beginning of every heartbeat,
         report the heart rate and inter-beat-interval.
      */
      if (pulseSensor.sawStartOfBeat()) {
        pulseSensor.outputBeat();
      }
    }

    /*******
      Here is a good place to add code that could take up
      to a millisecond or so to run.
    *******/
  }

  /******
     Don't add code here, because it could slow the sampling
     from the PulseSensor.
  ******/
}
Modifications to the sketch
We will modify three lines in this example sketch.
The sketch above works well with Arduino board. We will have to modify two lines in this sketch for it to effectively work with our ESP8266 board.
- As the built-in LED of ESP8266 is connected with GPIO2 so change the ‘PULSE_BLINK’ variable to 2.
const int PULSE_BLINK = 2; - Secondly, while defining the OUTPUT_TYPE variable, set it to PROCESSING_VISUALIZER. By default it was set to SERIAL_PLOTTER.
const int OUTPUT_TYPE = PROCESSING_VISUALIZER;To see the demonstration of the above code, upload the code to ESP8266. But, before uploading the code, make sure to select the ESP8266 board from Tools > Board and also select the correct COM port to which the board is connected from Tools > Port. Press the upload button to upload the code to your ESP8266 board.
Installing PulseSensor Amped Processing Visualizer
We will use GitHub to download the processing code and then place it in the Processing Documents folder. First, click here to open the GitHub page to download the code. The webpage when you open the link will look something like this.

Click the Code button and go to the Download Zip option as highlighted in the figure. Your zip file will get downloaded to your computer right away. After the download is complete, extract the .zip file and copy the PulseSensorAmpd_Processing_Visualizer folder inside the Processing Documents folder.
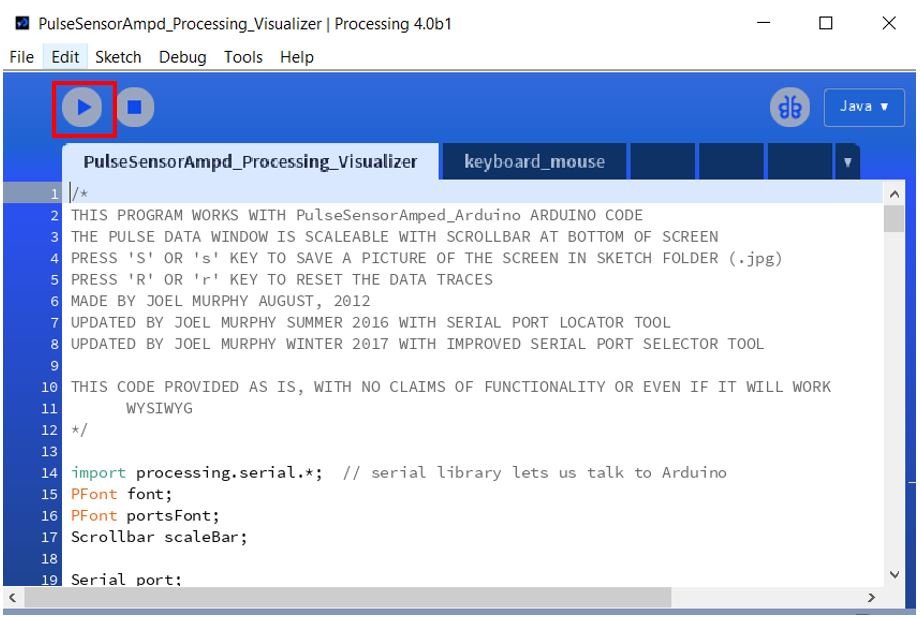
Now open Processing. Go to File > Sketchbook > PulseSensorAmped_Processing_Visualizer. The sketch will open up. Press the run button as shown below.
Now select the serial port through which your board is connected.

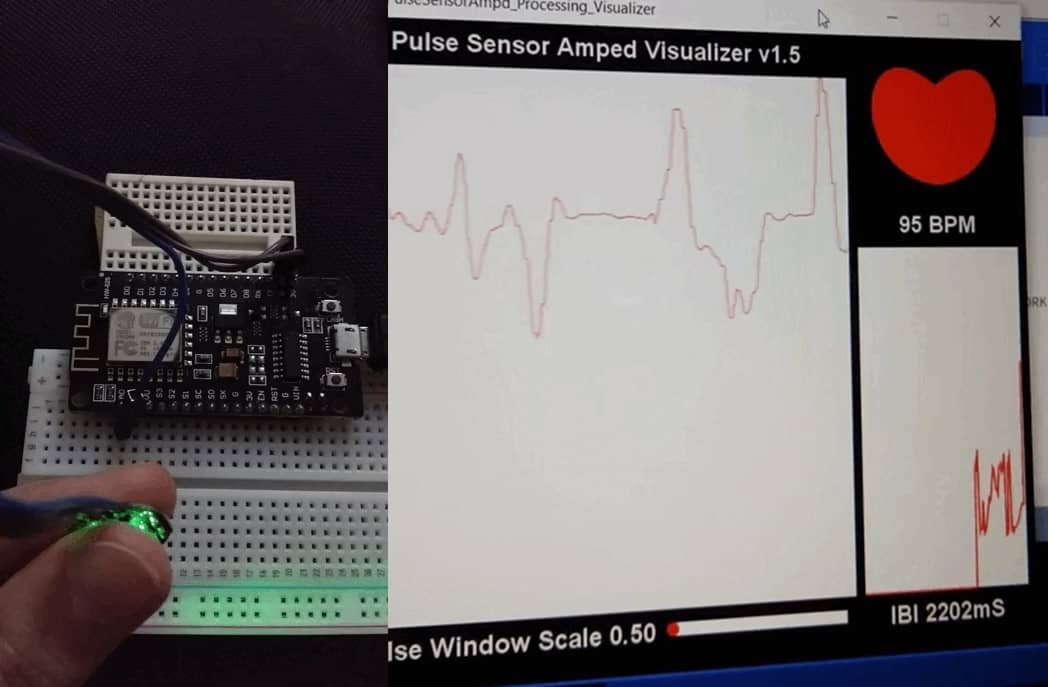
Now you will be able to view the pulse, the heart rate, and the inter-beat interval (IBI) in real-time.
Conclusion
In conclusion, we have learned about a simple pulse sensor interfacing with ESP8266 NodeMCU that detected pulse on the basis of light. Through various example sketches from the PulseSensor Playground library, we saw its different features. We monitored the user’s pulse through blinking the onboard LED as well as plotting it in the serial monitor. The heart rate (BPM) was also demonstrated through another example sketch. Additionally, we also used the pulse processing visualizer app to show the BPM, IBI, and pulse in real-time.
Have a look at pulse sensor related articles below: