Skip to content
  • Home
  • Microcontrollers
    • Pic Microcontroller
    • Arduino
    • ESP32 Tutorials and Projects
    • MicroPython ESP32/ESP8266
    • ESP8266 NodeMCU
    • FreeRTOS Arduino
    • 8051 microcontroller
    • AVR Microcontroller
  • ARM Microcontrollers
    • TM4C123 Tiva LaunchPad
    • STM32 Blue Pill
    • STM32 Nucleo
    • STM32F4 Discovery Board
    • MSP430 launchpad
  • Raspberry Pi
    • Raspberry Pi Pico
    • Raspberry Pi Pico W
    • Raspberry Pi
  • Softwares
    • Labview project
    • Proteus tutorials
    • PSpice tutorials
    • MATLAB
  • Electronics components
  • Contact
    • Editorial
    • Advertise

charts

Using Charts and Graphs in LabVIEW with Example: Tutorial 6
October 9, 2026
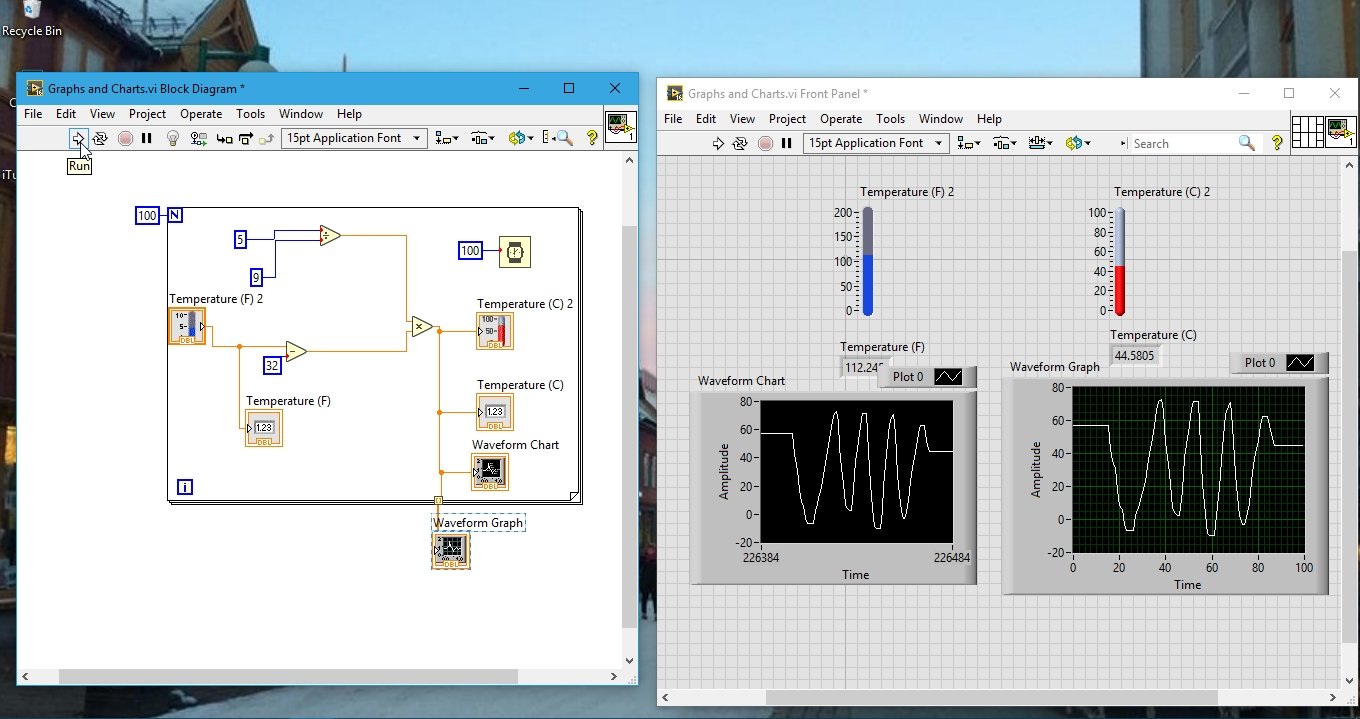
final graphs and charts output in labview

In the tutorial, we will discuss how to use charts, graphs, fill slides, and thermometers in LabVIEW. First, we will cover the introduction and uses of graphs and charts, and then we will focus on the example of the conversion of temperature from the Fahrenheit scale to the Celsius scale. We will do this using … Read more

Categories Labview project Tags charts, Labview, tutorial Leave a comment

Subscribe to Blog via Email

Categories

Recent Posts

  • Best 433MHz RF Bridges and RF/IR Hubs: 11 Broadlink RM4 Pro, BOND Bridge, Tuya and CC1101 Picks Compared (Buying Guide)
  • Best SONOFF Wi-Fi Smart Home Devices: 13 MINIR4, POW Elite, NSPanel, Matter Switches and Plugs Compared (Buying Guide)
  • Best TP-Link Kasa and Tapo Smart Home Devices: 14 Switches, Dimmers, Bulbs, Cameras, Hubs and Sensors Compared (Buying Guide)
  • Best ESP32 Ethernet and PoE Boards: 10 WT32-ETH01, Waveshare ESP32-S3 ETH and ESP32-P4 PoE Boards Compared (Buying Guide)
  • Best Wi-Fi Smart Relay Modules: 13 SONOFF MINIR4, BASICR4, Shelly and ESP32 Relay Boards Compared (Buying Guide)

Copyright © 2013-2026 Microcontrollerslab.com All Rights Reserved