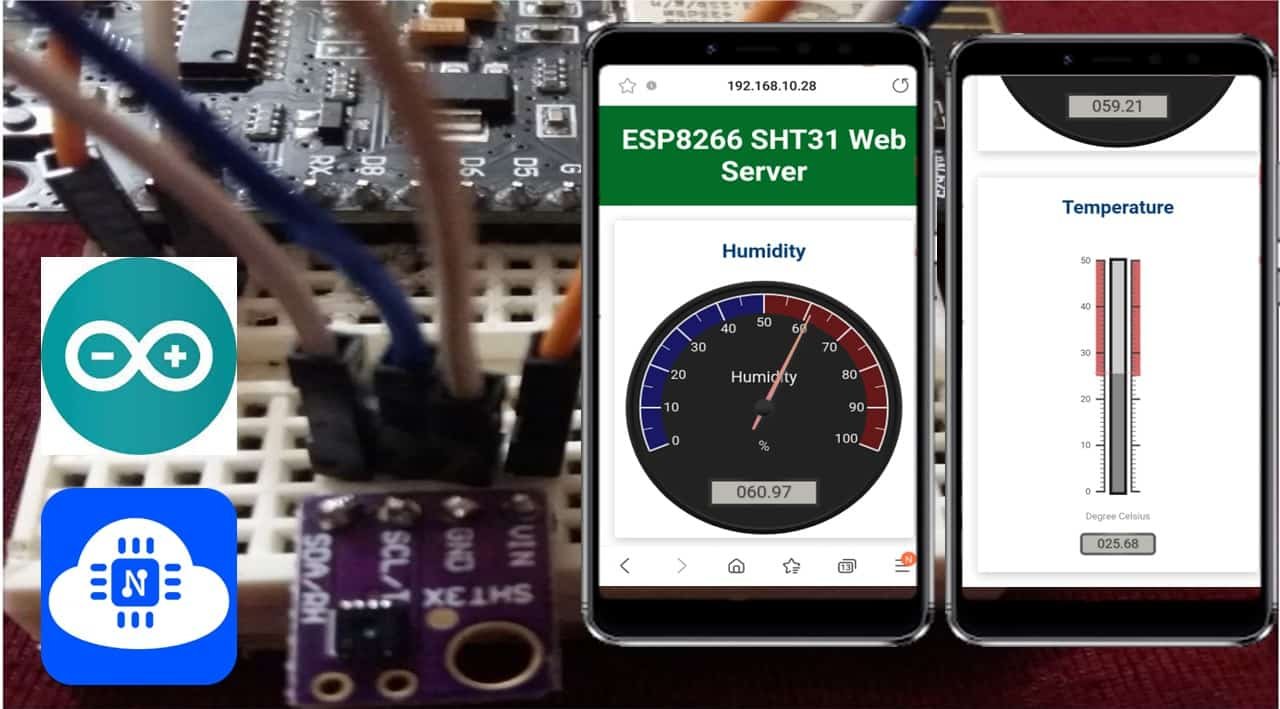
In this user guide, we will learn to build ESP8266 NodeMCU SHT31 Web server using Server-Sent Events (SSE). Using this technique, we will build an ESP8266 controlled web server that will automatically update sensor readings such as temperature and humidity to all connected web clients and display them in linear and radial gauges. Any appropriate sensor can be used such as BME280, DS18B20, BME680, LM35, and MPU6050 but for this article, we will use a SHT31 sensor which is used to measure temperature and humidity. We will use Arduino IDE to program our ESP8266 board which will be connected to a SHT31 sensor module.
Our client will receive automatic updates from the ESP8266 board with SSE through an HTTP connection. This will be highly useful to automatically send new sensor readings to the web client whenever they will be available. Without making any additional requests, the webpage will spontaneously update.
Moreover, to make our ESP8266 web server project more convenient and practical we will use the feature of ESP8266 LittleFS flash file system. We will save the HTML,CSS, and JavaScript files on ESP8266 LittleFS that will be used to build the web server. We can use LittleFS to store files without having to use any external memory of our ESP module.
We have a similar guide with ESP32:
ESP8266 SHT31 Gauges Web Server Project Overview
We aim to build a webpage that will display sensor readings in gauges obtained from SHT31 connected with the ESP8266 module. We will create a web server based on the Server-Sent Events (SSE) protocol that will display two types of gauges to show the sensor readings. It will consist of a title, “ESP8266 SHT31 Web Server,” and two cards. The first card will contain the heading ‘Humidity’ and a radial gauge to display humidity readings from SHT31 sensor. Likewise, the second card will contain the heading ‘Temperature’ and a linear gauge to display temperature readings from SHT31 sensor.
This transmission of data from the server (ESP8266) to the client (web page) will occur through Server-Sent Events. These readings will automatically update after every 10 seconds to new values when the web page receives them. Through SSE protocol, it will be very easy to update the sensor readings on our web page without adding any additional requests.
Note: We will use the canvas-gauges JavaScript library to help us create the two gauges.
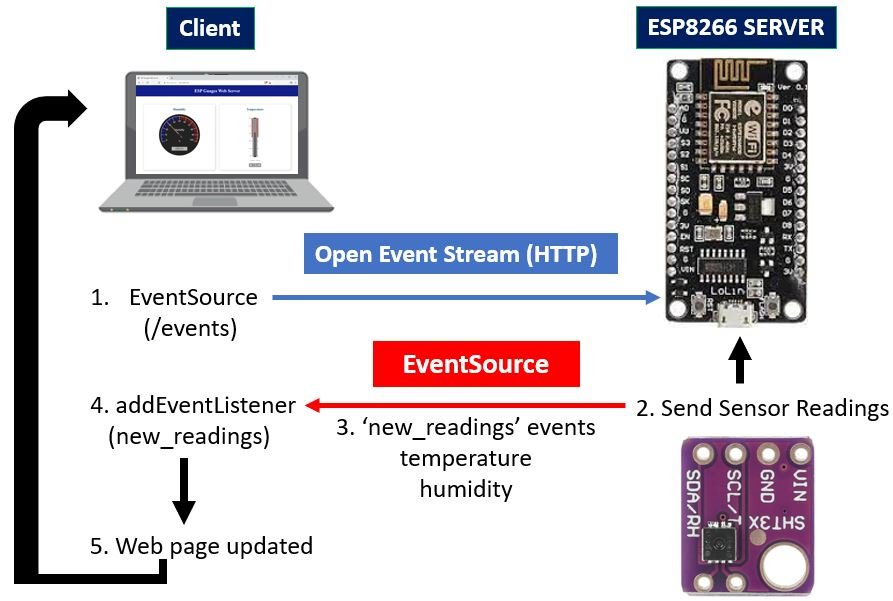
Working Process
- The client starts the SSE connection. It sends an HTTP request to the ESP8266 module. This will cause the module to send events to the web page.
- ESP8266 connected with SHT31 sensor module receives the sensor readings after every 10 seconds.
- The ‘new_readings’ events consist of the JSON string consisting of temperature and humidity readings.
- These events sent by the module have event listeners associated with them on the client-side. All the updated readings are received by the client on the said events.
- As in the case with SSE, only the ESP8266 board will be able to send events to the webpage. The web page gets updated accordingly and the process continues.
Recommended Reading: ESP8266 NodeMCU Server-Sent Events (SSE) Web Server (Arduino IDE)
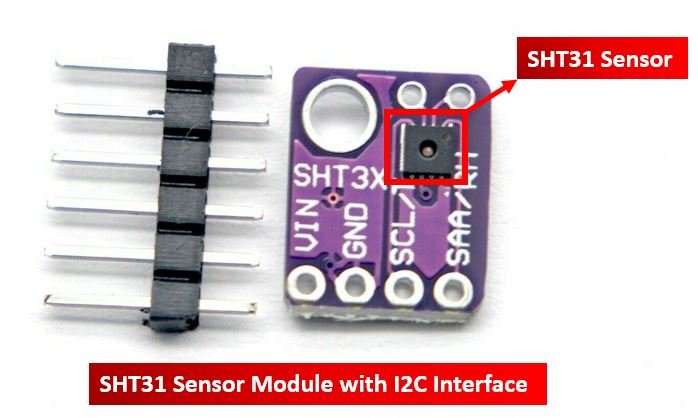
SHT31 Sensor Module Introduction
The SHT31 temperature and sensor module comes in a compact user-friendly size that features the SHT31 chip from Sensirion. This chip is in fact the temperature and humidity sensor that offers various functions, interfaces and extremely easy to use with a microcontroller. The sensor is able to measure temperature readings in the range of -40 to 125°C with a good accuracy of ±0.2°C. Similarly, the SHT32 chip also offers a humidity sensor which offers an operating humidity range of 0-100% with a typical relative humidity accuracy of 2%.
Due to its small size, low cost, and wide operating voltage range of 2.15-5.5V, the SHT31 sensor is a great choice to be used with microcontrollers for temperature and humidity measurements e.g. thermostats, weather stations, etc.
SHT31 Sensor Module Pinout
The following figure shows the pinout diagram of SHT31 sensor module. SHT31 sensor module consists of six pins.
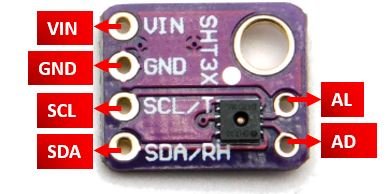
The following lists the pinout of the SHT31 sensor module and their brief description.
| SHT31 Module Pin | Description |
|---|---|
| VIN | This is the pin that supplies power to the sensor module in the range 2.4-5.5V. Connect it with 3.3V or Vin pin of ESP8266. |
| GND | This is the ground pin for providing the common ground between the devices. |
| SCL | This is the serial clock pin which generates the clock signal. |
| SDA | This is the serial data pin which is used to send and receive data |
| AD | This is the I2C address selection pin. |
| AL | This is the Alert output pin. |
Interface SHT31 Module with ESP8266
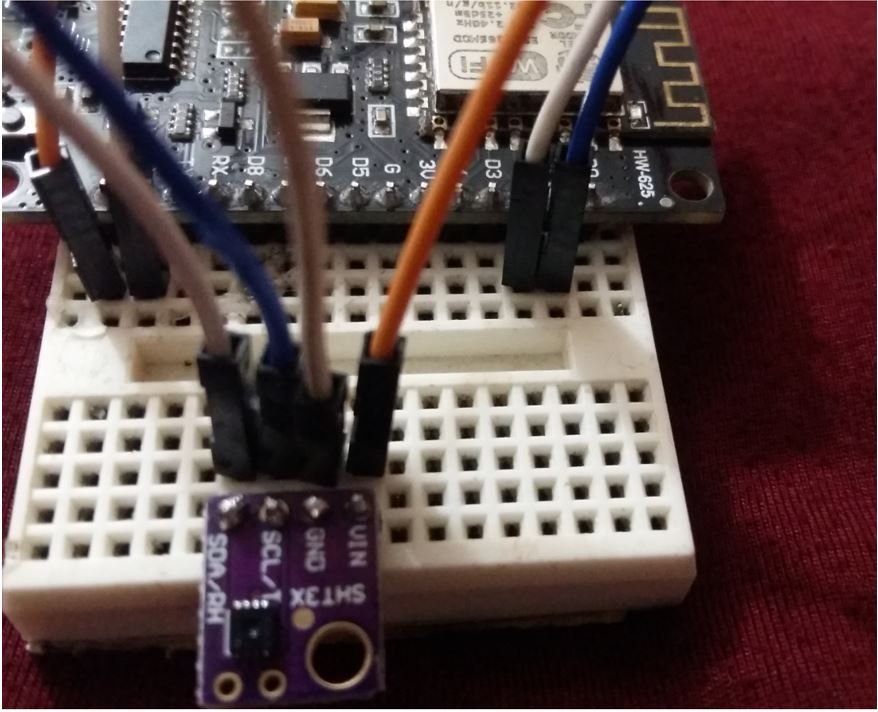
In this section, let us show you how to connect the SHT31 sensor module with the ESP8266 NodeMCU board.
You will need the following components
- ESP8266 NodeMCU board
- SHT31 Sensor Module
- Jumper wires
The connection of SHT31 with the ESP8266 board is super simple. Connect the VCC terminal of SHT31 module with 3.3V of ESP8266, ground with the ground (common ground), SCL of the sensor with SCL pin of ESP8266, and SDA of the sensor with the SDA pin of ESP8266.
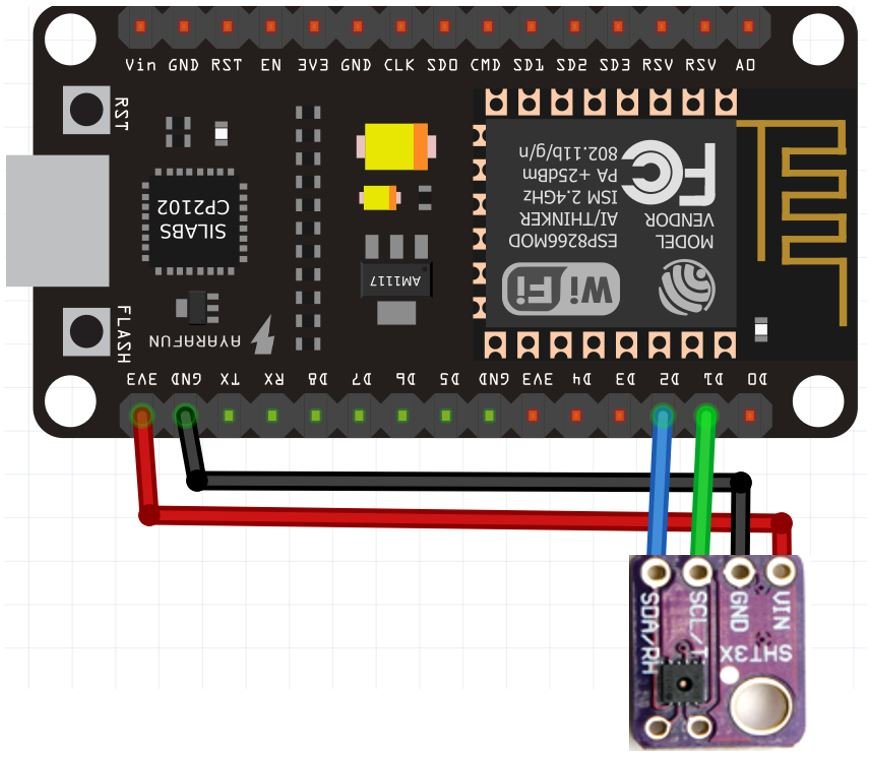
For ESP8266, the default I2C pins for SDA are GPIO4 (D2) and for SCL are GPIO5 (D1). The connections between the two devices can be seen in the table below.
| ESP8266 | SHT31 Module |
|---|---|
| 3.3V | Vin |
| GPIO4 (D2) | SDA |
| GPIO5 (D1) | SCL |
| GND | GND |
Follow the schematic diagram below for the ESP8266 module and connect them accordingly.
Setting up Arduino IDE
To follow this LittleFS base web server project, make sure you have the latest version of Arduino IDE and the ESP8266 NodeMCU add-on installed on your Arduino IDE. If you have not installed it before you can follow this tutorial:
Install ESP8266 in Arduino IDE ( Windows, Linux, and Mac OS)
Also, you will have to download and install the ESP8266 NodeMCU Filesystem Uploader Plugin in your Arduino IDE so that you are able to upload the LittleFS files on your ESP8266 NodeMCU board. If you haven’t, you can follow this tutorial:
LittleFS Introduction & Install ESP8266 NodeMCU Filesystem Uploader in Arduino IDE
Install SHT31 Arduino Library
As we are connecting the SHT31 sensor module with ESP8266, therefore, we will have to install the libraries to access the sensor data. We will require two libraries for this project:
- Adafruit SHT31
- Adafruit BusIO
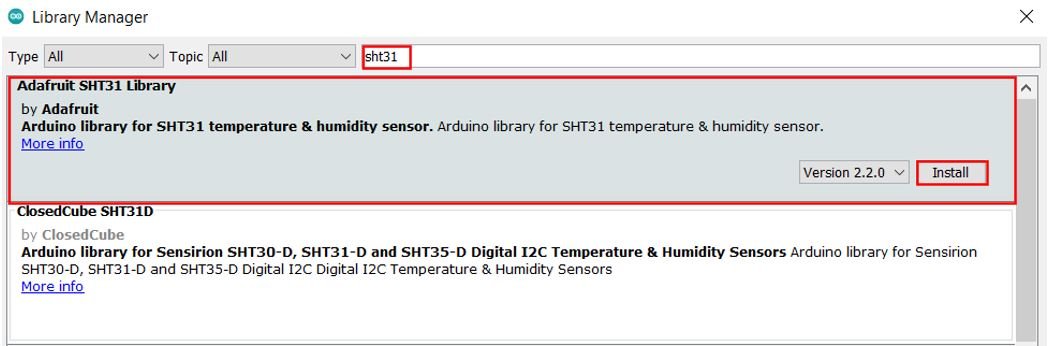
We will use the Library Manager in our Arduino IDE to install the latest versions of the libraries. Open your Arduino IDE and go to Sketch > Include Libraries > Manage Libraries. Type Adafruit SHT31 in the search bar and install the latest version.
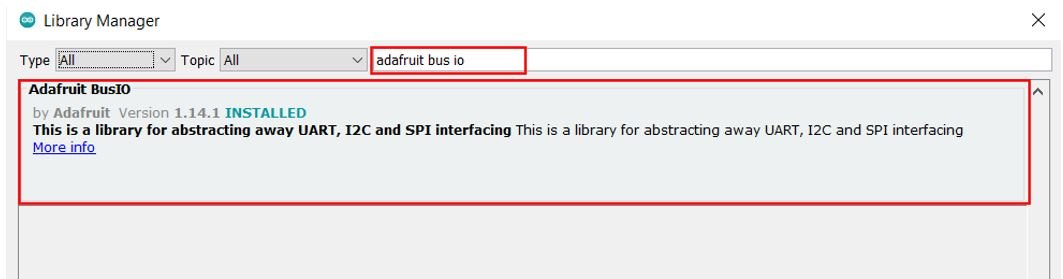
Type Adafruit BusIO in the search bar and install it as well.
Installing ESPAsyncWebServer Library and ESPAsyncTCP Library
We will need two additional libraries to build our web server. The ESPAsyncWebServer library will help us in creating our web server easily. With this library, we will set up an asynchronous HTTP server. ESPAsyncTCP is another library that we will be incorporating as it a dependency for the ESPAsyncWebServer library. Both of these libraries are not available in the Arduino library manager so we will have to download and load them in our ESP8266 NodeMCU board ourselves.
- To install the ESPAsyncWebServer library for free, click here to download. You will download the library as a .zip folder which you will extract and rename as ‘ESPAsyncWebServer.’ Then, transfer this folder to the installation library folder in your Arduino IDE.
- To install the ESPAsyncTCP library for free, click here to download. You will download the library as a .zip folder which you will extract and rename as ‘ESPAsyncTCP.’ Then, transfer this folder to the installation library folder in your Arduino IDE.
Likewise, you can also go to Sketch > Include Library > Add .zip Library inside the IDE to add the libraries as well. After installation of the libraries, restart your IDE.
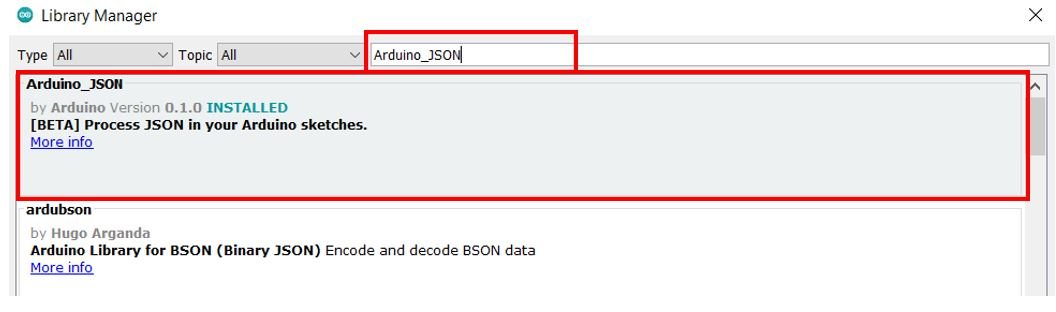
Installing Arduino_JSON Library
You will also have to install the Arduino_JSON library as we will be dealing with JSON script. Open your Arduino Library Manager by clicking Sketch > Include Library > Manage Libraries. Type ‘Arduino_JSON’ in the search tab and press enter. Install the library which is highlighted below.
After installation of the libraries, restart your IDE.
Creating Files for LittleFS
In most of our web server projects with ESP8266 NodeMCU, we have included HTML and CSS files inside our Arduino sketch. We save these HTML documents inside Arduino sketch by converting them into strings. Whenever a web client makes an HTTTP request, we send this string as a response which is basically a web page.
On the contrary, with LittleFS, we can save HTML, CSS, and Javascript files in ESP8266 NodeMCU flash file system. Whenever a web client makes an HTTTP request, we can serve these files directly from LittleFS.
To build ESP8266 NodeMCU web server using LittleFS, we will create three different files: HTML, CSS, and Arduino sketch and organize them in a project folder like shown below:
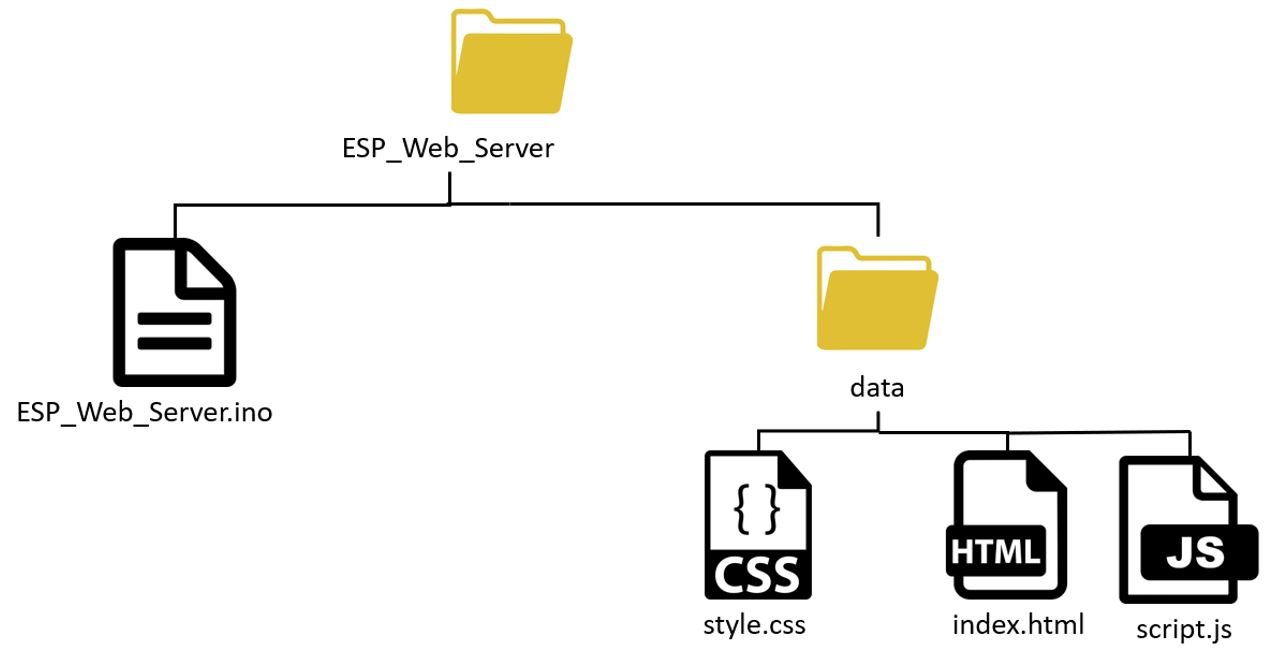
Note: You should place HTML, CSS and JavaScript files inside the data folder. Otherwise, LittleFS library will not be able to read these files.
Recommended reading: ESP8266 NodeMCU Web Server with LittleFS (SPI Flash File System)
Creating HTML file
Inside our HTML file, we will specify the title of the web page and the two cards to display the gauges.
Now, create an index.html file and replicate the code given below in that file.
<!DOCTYPE html>
<html>
  <head>
    <title>ESP8266 SHT31 Web Server</title>
    <meta name="viewport" content="width=device-width, initial-scale=1">
    <link rel="icon" type="image/png" href="favicon.png">
    <link rel="stylesheet" href="https://use.fontawesome.com/releases/v5.7.2/css/all.css" integrity="sha384-fnmOCqbTlWIlj8LyTjo7mOUStjsKC4pOpQbqyi7RrhN7udi9RwhKkMHpvLbHG9Sr" crossorigin="anonymous">
    <link rel="stylesheet" type="text/css" href="style.css">
    http://cdn.rawgit.com/Mikhus/canvas-gauges/gh-pages/download/2.1.7/all/gauge.min.js
  </head>
  <body>
    <div class="topnav">
      <h1>ESP8266 SHT31 Web Server</h1>
    </div>
    <div class="content">
      <div class="card-grid">
        <div class="card">
          <p class="card-title">Humidity</p>
          <canvas id="gauge-humidity"></canvas>
        </div>
        <div class="card">
          <p class="card-title">Temperature</p>
          <canvas id="gauge-temperature"></canvas>
        </div>
      </div>
    </div>
    http://script.js
  </body>
</html>
Building the Web page
We will start with the title of the web page. The tag will indicate the beginning of the <title> and the </title> tag will indicate the ending. In between these tags, we will specify “ESP8266 SHT31 Web Server” which will be displayed in the browser’s title bar.
<title>ESP8266 SHT31 Web Server</title>Next, we will create a meta tag to make sure our web server is available for all browsers e.g., smartphones, laptops, computers etc.
<meta name="viewport" content="width=device-width, initial-scale=1">Between the <head></head> tags, we will reference the CSS file as we’ll be creating different files for both HTML and CSS by using the <link> tag. This tag will be used so that we can link with an external style sheet which we will specify as a CSS file. It will consist of three attributes. The first one is rel which shows the relationship between the current file and the one which is being linked.
We will specify “stylesheet” which will change the visuals of the web page. The second attribute is type which we will specify as “text/css” as we will be using the CSS file for styling purpose. The third attribute is href and it will specify the location of the linked file. Both of the files (HTML & CSS) will be saved in the same folder (data) so we will just specify the name of the CSS file that is “style.css.”
<link rel="stylesheet" type="text/css" href="style.css">Additionally, we will reference the canvas-gauges library as well to create the gauges.
http://cdn.rawgit.com/Mikhus/canvas-gauges/gh-pages/download/2.1.7/all/gauge.min.jsBody
Inside the HTML web page body, we will include the heading and the cards that will display the gauges with the sensor readings. This will go inside the <body></body> tags which will mark the beginning and the ending of the script.
We will include the heading of our webpage inside the <h1></h1> tags and it will be “ESP8266 SHT31 Web Server”.
<h1>ESP8266 SHT31 Web Server</h1>Next, the following lines of code will be used to create the two gauges. We have included two cards which we will use to display the gauges. The first card has the title ‘Humidity’ and has a <canvas> id ‘gauge-humidity’ that will be used later on to display the radial gauge. Likewise, the second card has the title ‘Temperature’ and has a <canvas> id ‘gauge-temperature’ that will be used later on to display the linear gauge.
    </div>
    <div class="content">
      <div class="card-grid">
        <div class="card">
          <p class="card-title">Humidity</p>
          <canvas id="gauge-humidity"></canvas>
        </div>
        <div class="card">
          <p class="card-title">Temperature</p>
          <canvas id="gauge-temperature"></canvas>
        </div>
      </div>
    </div>
Creating CSS File
Next, create another file “style.css” in the data folder and copy the code given below in that file. CSS is used to give styles to a web page.
html {
  font-family: New Times Roman;
  display: inline-block;
  text-align: center;
}
h1 {
  font-size: 2.0rem;
  color: white;
}
p {
  font-size: 1.6rem;
}
.topnav {
  overflow: hidden;
  background-color: #036e27;
}
body {
  margin: 0;
}
.content {
  padding: 5%;
}
.card-grid {
  max-width: 1200px;
  margin: 0 auto;
  display: grid;
  grid-gap: 2rem;
  grid-template-columns: repeat(auto-fit, minmax(200px, 1fr));
}
.card {
  background-color: white;
  box-shadow: 2px 2px 12px 1px rgba(140,140,140,.5);
}
.card-title {
  font-size: 1.4rem;
  font-weight: bold;
  color: #034078
}
To add CSS files in head tags, we will use <style></style> tags to mark the beginning and the end. We will set the display text to font type Times New Roman and align it in the center of the webpage. The font size, color and positioning of the heading, paragraphs and the cards will also be set.
Creating JavaScript File
Now create another file in the data folder and name it ‘script.js.’ The JavaScript file will be responsible for handling the SSE events and the creation of the gauges using the canvas-gauges library.
// Get current sensor readings when the page loads
window.addEventListener('load', getReadings);

// Create Temperature Gauge
var gaugeTemperature = new LinearGauge({
  renderTo: 'gauge-temperature',
    width: 120,
    height: 400,
    units:"Degree Celsius",
    minValue: 0,
    maxValue: 50,
    majorTicks: [
        "0",
        "10",
        "20",
        "30",
        "40",
        "50",
    ],
    minorTicks: 10,
    strokeTicks: true,
    highlights: [
        {
            "from": 25,
            "to": 50,
            "color": "rgba(200, 50, 50, .75)"
        }
    ],
    colorPlate: "transparent",
    borderShadowWidth: 0,
    borders: false,
    needleType: "arrow",
    needleWidth: 2,
    animationDuration: 1500,
    animationRule: "linear",
    tickSide: "both",
    numberSide: "left",
    needleSide: "both",
    barStrokeWidth: 7,
    barBeginCircle: false,
}).draw();

// Create Humidity Gauge
var gaugeHumidity = new RadialGauge({
    renderTo: 'gauge-humidity',
    width: 300,
    height: 300,
    units: "%",
    title: "Humidity",
    minValue: 0,
    maxValue: 100,
    majorTicks: [
        0,
        10,
        20,
        30,
        40,
        50,
        60,
        70,
        80,
        90,
        100,

    ],
    minorTicks: 2,
    strokeTicks: true,
    highlights: [
        {
            "from": 0,
            "to": 50,
            "color": "rgba(0,0, 255, .3)"
        },
        {
            "from": 50,
            "to": 100,
            "color": "rgba(255, 0, 0, .3)"
        }
    ],
    ticksAngle: 225,
    startAngle: 67.5,
    colorMajorTicks: "#ddd",
    colorMinorTicks: "#ddd",
    colorTitle: "#eee",
    colorUnits: "#ccc",
    colorNumbers: "#eee",
    colorPlate: "#222",
    borderShadowWidth: 0,
    borders: true,
    needleType: "arrow",
    needleWidth: 2,
    needleCircleSize: 7,
    needleCircleOuter: true,
    needleCircleInner: false,
    animationDuration: 1500,
    animationRule: "linear",
    colorBorderOuter: "#333",
    colorBorderOuterEnd: "#111",
    colorBorderMiddle: "#222",
    colorBorderMiddleEnd: "#111",
    colorBorderInner: "#111",
    colorBorderInnerEnd: "#333",
    colorNeedleShadowDown: "#333",
    colorNeedleCircleOuter: "#333",
    colorNeedleCircleOuterEnd: "#111",
    colorNeedleCircleInner: "#111",
    colorNeedleCircleInnerEnd: "#222",
    valueBoxBorderRadius: 0,
    colorValueBoxRect: "#222",
    colorValueBoxRectEnd: "#333"
}).draw();

// Function to get current readings on the webpage when it loads for the first time
function getReadings(){
  var xhr = new XMLHttpRequest();
  xhr.onreadystatechange = function() {
    if (this.readyState == 4 && this.status == 200) {
      var myObj = JSON.parse(this.responseText);
      console.log(myObj);
      var temp = myObj.temperature;
      var hum = myObj.humidity;
      gaugeTemperature.value = temp;
      gaugeHumidity.value = hum;
    }
  };
  xhr.open("GET", "/readings", true);
  xhr.send();
}

if (!!window.EventSource) {
  var source = new EventSource('/events');

  source.addEventListener('open', function(e) {
    console.log("Events Connected");
  }, false);

  source.addEventListener('error', function(e) {
    if (e.target.readyState != EventSource.OPEN) {
      console.log("Events Disconnected");
    }
  }, false);

  source.addEventListener('message', function(e) {
    console.log("message", e.data);
  }, false);

  source.addEventListener('new_readings', function(e) {
    console.log("new_readings", e.data);
    var myObj = JSON.parse(e.data);
    console.log(myObj);
    gaugeTemperature.value = myObj.temperature;
    gaugeHumidity.value = myObj.humidity;
  }, false);
}
The following line calls the function getReadings when the web page loads.
window.addEventListener('load', getReadings);Create the Gauges
To build the gauges we will use canvas-gauges library. We will display two type of gauges: linear and radial. The temperature reading will be displayed in a linear gauge that will look like a thermometer. Similarly, the humidity reading will be displayed in a radial gauge.
To create a linear gauge for the temperature, we will use the following lines of code:
The ‘gaugeTemperature’ var will be used to create the linear gauge using the LinearGauge() method. This method takes in several parameters that involve the dimensions, minimum/maximum value, colors and overall visuals of the gauge. Moreover, we specify the ‘gauge-temperature’ id that will be used to properly place this gauge in the <canvas> HTML element with the appropriate id. Use the draw() method to display the gauge.
// Create Temperature Gauge
var gaugeTemperature = new LinearGauge({
  renderTo: 'gauge-temperature',
    width: 120,
    height: 400,
    units:"Degree Celsius",
    minValue: 0,
    maxValue: 50,
    majorTicks: [
        "0",
        "10",
        "20",
        "30",
        "40",
        "50",
    ],
    minorTicks: 10,
    strokeTicks: true,
    highlights: [
        {
            "from": 25,
            "to": 50,
            "color": "rgba(200, 50, 50, .75)"
        }
    ],
    colorPlate: "transparent",
    borderShadowWidth: 0,
    borders: false,
    needleType: "arrow",
    needleWidth: 2,
    animationDuration: 1500,
    animationRule: "linear",
    tickSide: "both",
    numberSide: "left",
    needleSide: "both",
    barStrokeWidth: 7,
    barBeginCircle: false,
}).draw();
Likewise, to create a radial gauge to display the humidity reading, we will use the following lines of code:
The ‘gaugeHumidity’ var will be used to create the linear gauge using the RadialGauge() method. This method takes in several parameters that involve the dimensions, minimum/maximum value, colors and overall visuals of the gauge. Moreover, we specify the ‘gauge-humidity’ id that will be used to properly place this gauge in the <canvas> HTML element with the appropriate id. Use the draw() method to display the gauge.
// Create Humidity Gauge
var gaugeHumidity = new RadialGauge({
    renderTo: 'gauge-humidity',
    width: 300,
    height: 300,
    units: "%",
    title: "Humidity",
    minValue: 0,
    maxValue: 100,
    majorTicks: [
        0,
        10,
        20,
        30,
        40,
        50,
        60,
        70,
        80,
        90,
        100,

    ],
    minorTicks: 2,
    strokeTicks: true,
    highlights: [
        {
            "from": 0,
            "to": 50,
            "color": "rgba(0,0, 255, .3)"
        },
        {
            "from": 50,
            "to": 100,
            "color": "rgba(255, 0, 0, .3)"
        }
    ],
    ticksAngle: 225,
    startAngle: 67.5,
    colorMajorTicks: "#ddd",
    colorMinorTicks: "#ddd",
    colorTitle: "#eee",
    colorUnits: "#ccc",
    colorNumbers: "#eee",
    colorPlate: "#222",
    borderShadowWidth: 0,
    borders: true,
    needleType: "arrow",
    needleWidth: 2,
    needleCircleSize: 7,
    needleCircleOuter: true,
    needleCircleInner: false,
    animationDuration: 1500,
    animationRule: "linear",
    colorBorderOuter: "#333",
    colorBorderOuterEnd: "#111",
    colorBorderMiddle: "#222",
    colorBorderMiddleEnd: "#111",
    colorBorderInner: "#111",
    colorBorderInnerEnd: "#333",
    colorNeedleShadowDown: "#333",
    colorNeedleCircleOuter: "#333",
    colorNeedleCircleOuterEnd: "#111",
    colorNeedleCircleInner: "#111",
    colorNeedleCircleInnerEnd: "#222",
    valueBoxBorderRadius: 0,
    colorValueBoxRect: "#222",
    colorValueBoxRectEnd: "#333"
}).draw();
Get Readings
The getReadings() will be responsible to obtain the current SHT31 sensor readings.
function getReadings(){
  var xhr = new XMLHttpRequest();
  xhr.onreadystatechange = function() {
    if (this.readyState == 4 && this.status == 200) {
      var myObj = JSON.parse(this.responseText);
      console.log(myObj);
      var temp = myObj.temperature;
      var hum = myObj.humidity;
      gaugeTemperature.value = temp;
      gaugeHumidity.value = hum;
    }
  };
  xhr.open("GET", "/readings", true);
  xhr.send();
}
Through this function, the HTTP GET request will be made to the ESP module regarding sending the SHT31 sensor readings.
Inside this function we use the XMLHttpRequest. This will allow us to make an HTTP request in JavaScript. To make the HTTP GET request to we will follow three steps:
Firstly, we will create an XMLHttpRequest as follows:
var xhr = new XMLHttpRequest();Secondly, we will initialize the request by using the xhr.open() method. Inside it we will pass on three arguments. The first argument specifies the type of HTTP method which is GET in our case. The second argument is the URL to which our ESP8266 will request upon. In our case, it will be /readings. The last argument is true which specifies that the request is asynchronous.
xhr.open("GET", "/readings", true);Lastly, we will use xhr.send() to open the connection. Our server (ESP8266) will now be able to receive the HTTP GET request whenever the page first loads.
xhr.send();Additionally, we will define a function that will be executed when the readyState property changes. In our case, we have set the response to be sent when the status is OK (200) and the readyState to ‘4’ that means that the response is ready.
Now, as the response, the ESP8266 board sends the sensor readings in a JSON string. This string will be first converted to a JSON object and logged on the console. Moreover, to set the gauge readings we will set the value of gauges with the current sensor readings. In our case, the temperature gauge is called ‘gaugeTemperature’ hence we will set its value by using gaugeTemperature.value to temp (current temperature reading). Similarly, for the humidity gauge we will use gaugeHumidity.value to hum (current humidity reading).
  xhr.onreadystatechange = function() {
    if (this.readyState == 4 && this.status == 200) {
      var myObj = JSON.parse(this.responseText);
      console.log(myObj);
      var temp = myObj.temperature;
      var hum = myObj.humidity;
      gaugeTemperature.value = temp;
      gaugeHumidity.value = hum;
    }
  };
Receive and Handle SSE Events
We will mainly handle four kinds of occurrences:
- Connection
- Disconnection
- Messages sent by the server
- events
Firstly, we will define an event source and pass the /events URL inside it. This URL will send the updates to our web page.
if (!!window.EventSource) {
  var source = new EventSource('/events');
Then, we will use the addEventListener() function to listen to incoming events. It will have two arguments. The first will be the event name and the second will be function(e).
The following are listeners for connection, disconnection and incoming messages from the server. We used the default event listeners in this case which were listed in the Documentation.
  source.addEventListener('open', function(e) {
    console.log("Events Connected");
  }, false);

  source.addEventListener('error', function(e) {
    if (e.target.readyState != EventSource.OPEN) {
      console.log("Events Disconnected");
    }
  }, false);

  source.addEventListener('message', function(e) {
    console.log("message", e.data);
  }, false);
Next, we will include listener for ‘new_readings’. This event will be sent to the web server. When the client will receive the particular event, it will print the SHT31 sensor readings on the browser console. Additionally, the readings will be changed to a JSON object which will then be displayed on their respective gauges.
  source.addEventListener('new_readings', function(e) {
    console.log("new_readings", e.data);
    var myObj = JSON.parse(e.data);
    console.log(myObj);
    gaugeTemperature.value = myObj.temperature;
    gaugeHumidity.value = myObj.humidity;
  }, false);
Arduino Sketch ESP8266 SHT31 Web Server
Now, open your Arduino IDE and go to File > New to open a new file. Copy the code given below in that file and save it as ‘ESP_Web_Server’.
Remember to replace your network credentials.
#include <Arduino.h>
#include <ESP8266WiFi.h>
#include <ESPAsyncTCP.h>
#include <ESPAsyncWebServer.h>
#include "LittleFS.h"
#include <Arduino_JSON.h>
#include <Wire.h>
#include "Adafruit_SHT31.h"

// Replace with your network credentials
const char* ssid = "YOUR_SSID";
const char* password = "YOUR_PASSWORD";

AsyncWebServer server(80);
AsyncEventSource events("/events");

JSONVar readings;

unsigned long previous_time = 0;
unsigned long Delay = 10000;

Adafruit_SHT31 sht31 = Adafruit_SHT31();

// Get Sensor Readings and return JSON object
String getReadings(){
  readings["temperature"] = String(sht31.readTemperature());
  readings["humidity"] =  String(sht31.readHumidity());
  String jsonString = JSON.stringify(readings);
  return jsonString;
}

void setup() {
  Serial.begin(115200);

  if (! sht31.begin(0x44)) {
    Serial.println("Check circuit. SHT31 not found!");
    while (1) delay(1);
  }

  WiFi.mode(WIFI_STA);
  WiFi.begin(ssid, password);
  Serial.println("Connecting to WiFi ..");
  while (WiFi.status() != WL_CONNECTED) {
    Serial.print('.');
    delay(1000);
  }
  Serial.println(WiFi.localIP());

     // Initialize LittleFS
  if(!LittleFS.begin()){
    Serial.println("An Error has occurred while mounting LittleFS");
    return;
  }

  // Web Server Root URL
  server.on("/", HTTP_GET, [](AsyncWebServerRequest *request){
    request->send(LittleFS, "/index.html", "text/html");
  });

  server.serveStatic("/", LittleFS, "/");

  // Request for the latest sensor readings
  server.on("/readings", HTTP_GET, [](AsyncWebServerRequest *request){
    String json = getReadings();
    request->send(200, "application/json", json);
    json = String();
  });

  events.onConnect([](AsyncEventSourceClient *client){
    if(client->lastId()){
      Serial.printf("Client reconnected! Last message ID that it got is: %u\n", client->lastId());
    }
    client->send("hello!", NULL, millis(), 10000);
  });
  server.addHandler(&events);
  server.begin();
}

void loop() {
  if ((millis() - previous_time) > Delay) {
    Serial.println(getReadings());
    events.send("ping",NULL,millis());
    events.send(getReadings().c_str(),"new_readings" ,millis());
    previous_time = millis();
  }
}
How the Code Works?
Firstly, we will include the necessary libraries. As we have to connect our ESP8266 to a wireless network hence we need ESP8266WiFi.h library for that purpose. The ESPAsyncWebServer.h and ESPAsyncTCP.h libraries are the ones that we recently downloaded and will be required for the building of the asynchronous web server. The Adafruit_SHT31.h library is used in implementing the hardware functionalities of the sensor. Additionally, the Arduino_JSON library will be used as we will use a JSON strings to store the sensor readings. Also, the LittleFS library will allow us to access the flash memory file system of our ESP8266 core.
#include <Arduino.h>
#include <ESP8266WiFi.h>
#include <ESPAsyncTCP.h>
#include <ESPAsyncWebServer.h>
#include "LittleFS.h"
#include <Arduino_JSON.h>
#include <Wire.h>
#include "Adafruit_SHT31.h"
Next, we will create two global variables, one for the SSID and another for the password. These will hold our network credentials which will be used to connect to our wireless router. Replace both of them with your credentials to ensure a successful connection.
const char* ssid = "YOUR_SSID";
const char* password = "YOUR_PASSWORD";
Creating an AsyncWebServer Object
The AsyncWebServer object will be used to set up the ESP8266 web server. We will pass the default HTTP port which is 80, as the input to the constructor. This will be the port where the server will listen to the requests.
AsyncWebServer server(80);Defining an EventSource
Next, we will define an event source called ‘/events.’ You can use any appropriate name.
AsyncEventSource events("/events");Defining Variables
We will create a JSON variable called ‘readings’ to store the sensor readings.
JSONVar readings;Adding delay
The web server will update sensor readings after every 10 seconds. We will incorporate this value in the ‘Delay’ variable in milliseconds.
unsigned long previous_time = 0;
unsigned long Delay = 10000;
Creating Adafruit_SHT31 Object
Next we create the Adafruit_SHT31 object called ‘sht31.’
Adafruit_SHT31 sht31 = Adafruit_SHT31();Get Sensor Readings
The following getReadings() function will return a JSON string consisting of the temperature and humidity readings. We will use the sht31 object on the following methods: readTemperature() and readHumidity() individually to access each reading.
String getReadings(){
  readings["temperature"] = String(sht31.readTemperature());
  readings["humidity"] =  String(sht31.readHumidity());
  String jsonString = JSON.stringify(readings);
  return jsonString;
}
setup()
Inside the setup() function, we will open a serial connection at a baud rate of 115200.
Serial.begin(115200);Next we will initialize the SHT31 sensor. If the connection between the module and the sensor is incorrect it will print that message on the serial monitor.
  if (! sht31.begin(0x44)) {
    Serial.println("Check circuit. SHT31 not found!");
    while (1) delay(1);
  }
The following section of code will connect our ESP8266 board with the local network whose network credentials we already specified above. After the connection will be established, the IP address of the ESP8266 board will get printed on the serial monitor. This will help us to make a request to the server.
  WiFi.mode(WIFI_STA);
  WiFi.begin(ssid, password);
  Serial.println("Connecting to WiFi ..");
  while (WiFi.status() != WL_CONNECTED) {
    Serial.print('.');
    delay(1000);
  }
  Serial.println(WiFi.localIP());
These lines of code will initialize LittleFS.
  if(!LittleFS.begin()){
    Serial.println("An Error has occurred while mounting LittleFS");
    return;
  }
Handling Requests
We will use the on() method on the server object to listen to the incoming HTTP requests and execute functions accordingly. The send() method uses to return the HTTP response.
The index.html file will be sent to the client, whenever the server will receive a request on the “/” URL.
  server.on("/", HTTP_GET, [](AsyncWebServerRequest *request){
    request->send(LittleFS, "/index.html", "text/html");
  });

  server.serveStatic("/", LittleFS, "/");
When the server will receive a request on the /readings URL, the JSON string with the current SHT31 sensor readings will be sent.
  server.on("/readings", HTTP_GET, [](AsyncWebServerRequest *request){
    String json = getReadings();
    request->send(200, "application/json", json);
    json = String();
  });
The event source will be set up on our ESP8266 board thorough the following lines of code:
  events.onConnect([](AsyncEventSourceClient *client){
    if(client->lastId()){
      Serial.printf("Client reconnected! Last message ID that it got is: %u\n", client->lastId());
    }
    client->send("hello!", NULL, millis(), 10000);
  });
  server.addHandler(&events);
To start the server, we will call the begin() on our server object.
server.begin();loop()
In the loop() function we will check if 10 seconds have passed since the sensor readings were updated. Then we will call the getReadings() function. On the serial monitor, these current sensor readings will get displayed as a JSON string. Lastly, we will send all these updated sensor readings to the web browser. The web server will now get updated to new sensor readings.
void loop() {
  if ((millis() - previous_time) > Delay) {
    Serial.println(getReadings());
    events.send("ping",NULL,millis());
    events.send(getReadings().c_str(),"new_readings" ,millis());
    previous_time = millis();
  }
}
Demonstration
Follow the steps closely to ensure all the HTML,CSS and JavaScript files are properly uploaded to the flash memory of your development board.
- Save the Arduino sketch given above.
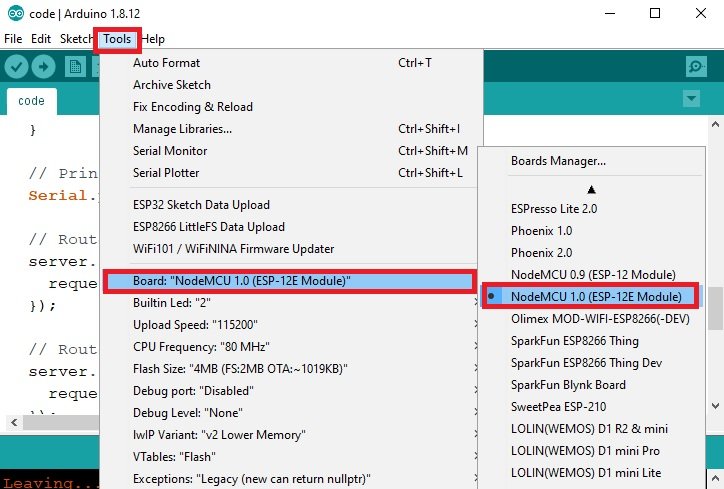
- Choose the correct board and COM port. Go to Tools > Board and select NodeMCU 1.0. Next, go to Tools > Port and select the appropriate port through which your board is connected.
- Before uploading the sketch to your ESP8266 board, first go to Sketch > Show Sketch Folder. This will open up the folder where your Arduino sketch is saved. Now create a new folder inside that folder and save it as ‘data.’ Place all the files inside the data folder. Otherwise, the LittleFS library will not be able to read them.
- Now, we will upload the files to our ESP8266 board. Go to Tools > ESP8266 LittleFS Data Upload.
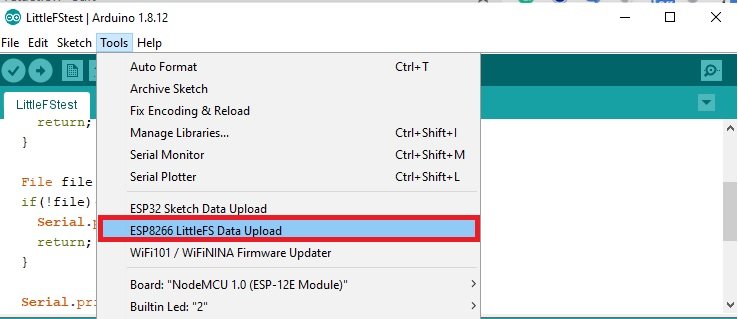
After a few moments, the files will be uploaded. You will receive the message ‘LittleFS Image Uploaded’ on the debugging window.
Note: Make sure that the total size of the data file is within the flash memory size. Otherwise you will get an error while uploading the files onto LittleFS.
- Click on the upload button to upload the code to the ESP8266 development board.
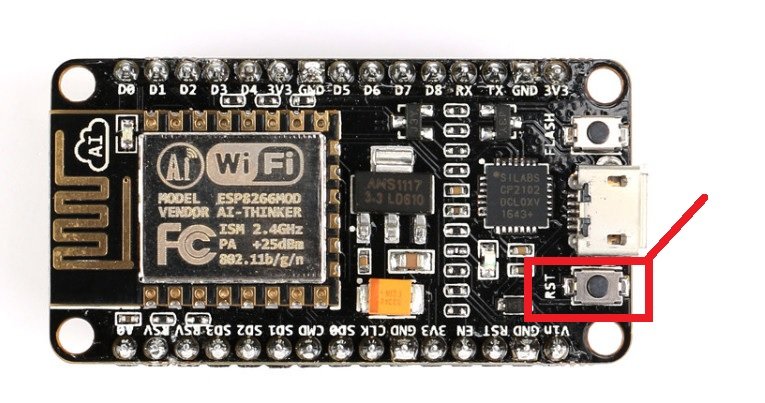
- After you have uploaded your code to the development board, press its RST button.
In your Arduino IDE, open up the serial monitor and you will be able to see the IP address of your ESP8266 module.
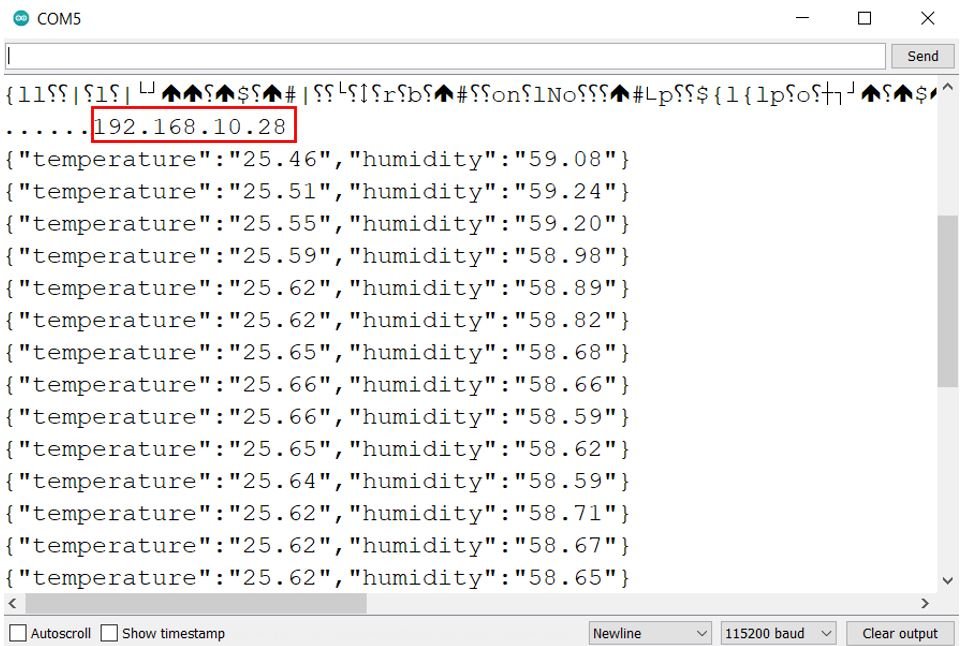
Copy that address into a web browser and press enter. The web server will look something like this:
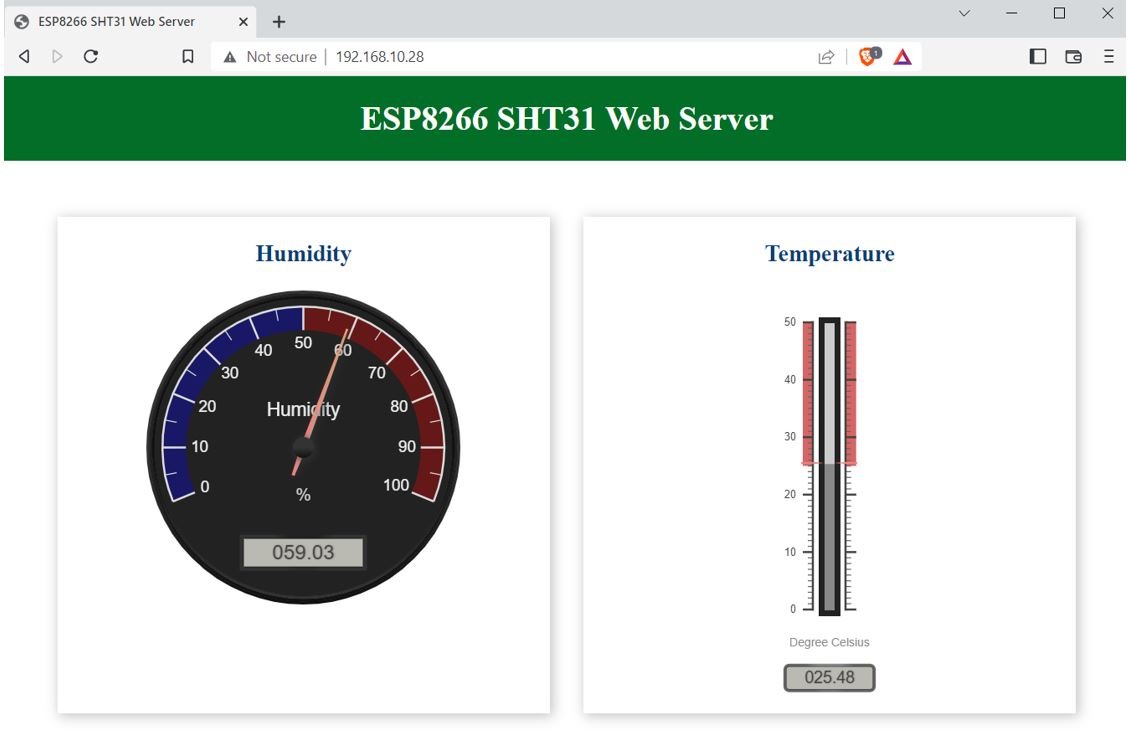
You can view all three sensor readings After every 10 seconds the sensor readings will get updated on both the serial monitor and the web page.

Other interesting ESP8266 NodeMCU Web Server Projects: