Tutorial number 1 on LabVIEW: Getting Started with LabVIEW: In this tutorial, we are going to start a new series of tutorials on LabVIEW. We will start from a very beginner level, and by the end of this series, you will be an expert in LabVIEW. We will be using LabVIEW 2015. In today’s tutorial, we will cover the following topics.
- History
- What is LabVIEW?
- LabVIEW Interface and First Program
Labview History
We come across different electrical systems in our daily lives. In the early days, systems were developed and controlled by humans. The world is now shifting towards automation with the advent of digital technology, and user interaction with these systems is decreasing as a result. This also reduces the chances of human error in performing specific tasks. All of this has been made possible thanks to various programming languages. As programming languages continue to evolve, more sophisticated and intelligent systems are being created. The following programming languages have been used over time to design these systems.
- Machine Code (001011)
- Low-Level Languages (Assembly, HDL)
- High-Level Textual Languages (C, C++, PHP)
- High-Level Graphical Languages (Simulink, Flow Code, LabVIEW)


Fig. 1: Programming Languages Timeline
According to the above figure, as languages are becoming high-level, their performance is increasing. LabVIEW can be seen as the most high-level language and hence is the best in terms of system design and speed.
Labview Introduction
LabVIEW (short for Laboratory Virtual Instrument Engineering Workbench) is a visual programming language and development environment created by National Instruments (now part of NI) for creating applications that involve measurement, control, and automation. It’s commonly used in various scientific, engineering, and research fields.
LabVIEW allows users to develop programs using a graphical interface, where functions and operations are represented as visual icons and wires connecting them. This approach is often referred to as “G” programming. It is particularly well-suited for tasks involving data acquisition, instrument control, process automation, data analysis, and creating user interfaces.
Features
Some key features of LabVIEW include:
Graphical Programming: Instead of writing traditional lines of code, LabVIEW users design their programs by dragging and connecting virtual representations of hardware components and functions.
Dataflow Paradigm: LabVIEW uses a dataflow programming paradigm, where data values determine the execution order of operations. When data is available at a node, that node executes.
Modularity and Reusability: Programs can be broken down into modular subcomponents, promoting code reuse and easier maintenance.
Integration: LabVIEW offers integration with various hardware devices, sensors, and instruments. It’s often used in conjunction with data acquisition hardware.
User Interface Development: LabVIEW enables the creation of user interfaces with customizable controls, graphs, and visual elements.
Signal Processing and Analysis: LabVIEW provides built-in tools and libraries for signal processing, data analysis, and visualization.
Real-Time and FPGA Support: LabVIEW can be used to develop real-time and FPGA (Field-Programmable Gate Array) applications, enabling applications with strict timing requirements.
Education and Research: LabVIEW is widely used in educational settings for teaching engineering and programming concepts, as well as in research environments for designing experiments and data analysis.
LabVIEW is used across a range of industries, including aerospace, automotive, electronics, biotechnology, and more. It offers a versatile platform for creating custom applications that involve measurement, control, automation, and data analysis, all while abstracting much of the complexity associated with traditional programming languages.
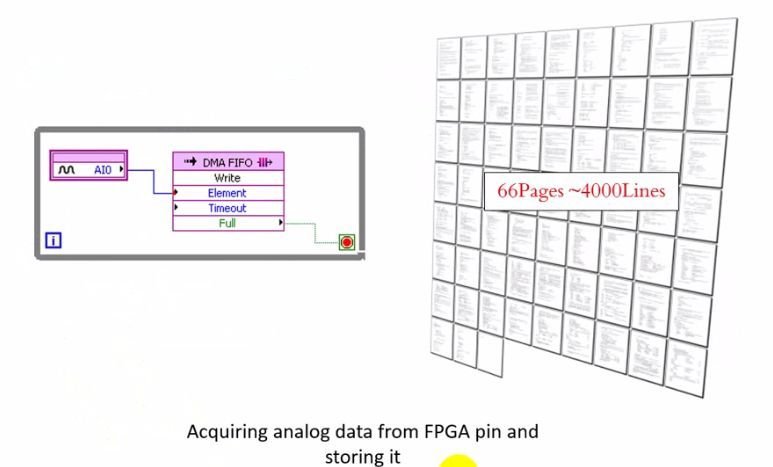

Fig. 2: Comparison of graphical and textual languages
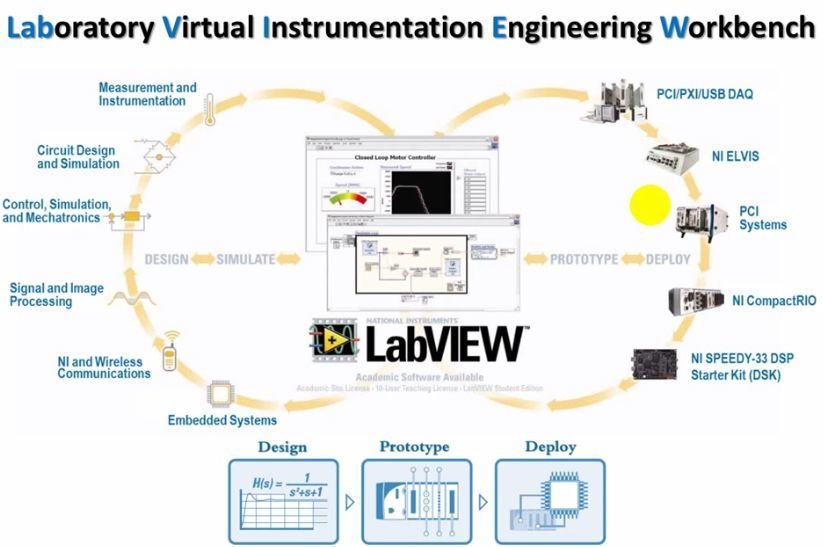
We can design, implement prototypes, and deploy them to hardware using LabVIEW. The following figure shows the different fields of systems that can be developed using LabVIEW. It reduces development time by 4 to 10 times and has tools to acquire, analyze, and present data.
LabVIEW in nutshell
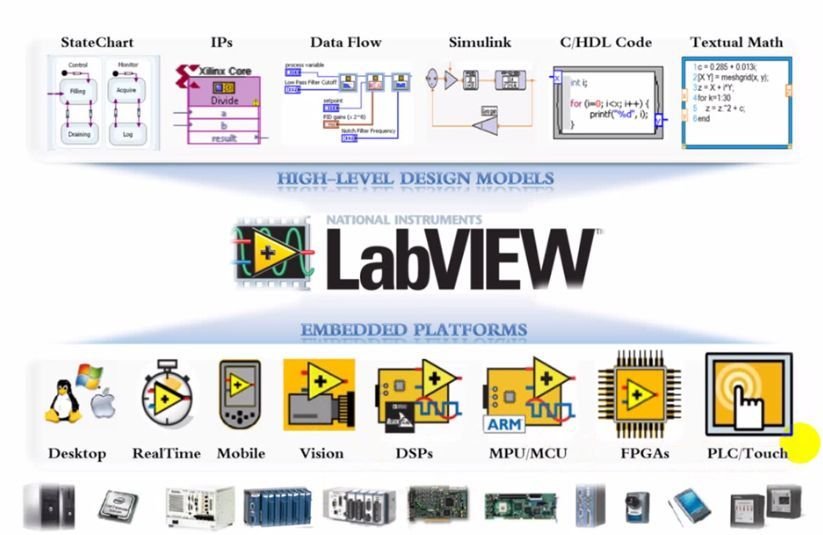
Different Platforms and systems to which LabVIEW can interact are shown below.
LabVIEW Capabilities
Labview Applications
Following are the key features of LabVIEW.
- Hardware Integration:
- I/O and Communication:
It connects to any instrument or sensor with built-in libraries and thousands of instrument drivers.
- Plug and Play Hardware:
It seamlessly integrates NI plug-and-play devices for USB, Ethernet, WI-FI, and more.
- Advanced Built-In Analysis and Signal Processing:
- Built-In Analysis:
It accesses thousands of engineering-specific functions such as frequency analysis curve cutting and more.
- Inline Signal Processing:
It interacts with measurements and performs inline analysis in real time on acquired signals.
- Data Display and User Interface:
- Built-in Controls:
It interacts with data using hundreds of drag-and-drop control, graphs, and 3D visualization tools.
Getting Started Video Tutorial
Create Your First Labview Program and Project
Having a basic understanding of LabVIEW capabilities, now we will move on to the software part. In this section, we will deal with the actual LabVIEW 2015 software. We will explore its interface and the different controls available for various purposes. Before starting, please remember:
- Block diagram execution is dependent on the flow of data.
- Block diagram does not execute left to right.
- Node executes when data is available to ALL input terminals.
- Node supply data to all output terminals when done.
- If the computer running code had multiple processors, two pieces of code could run independently without additional coding.
- Wires are used to transfer data between objects of block diagram. Wires are of different colors, styles and thickness depending on their data types. A broken wire appears as a dashed black line with a red “X” in the middle
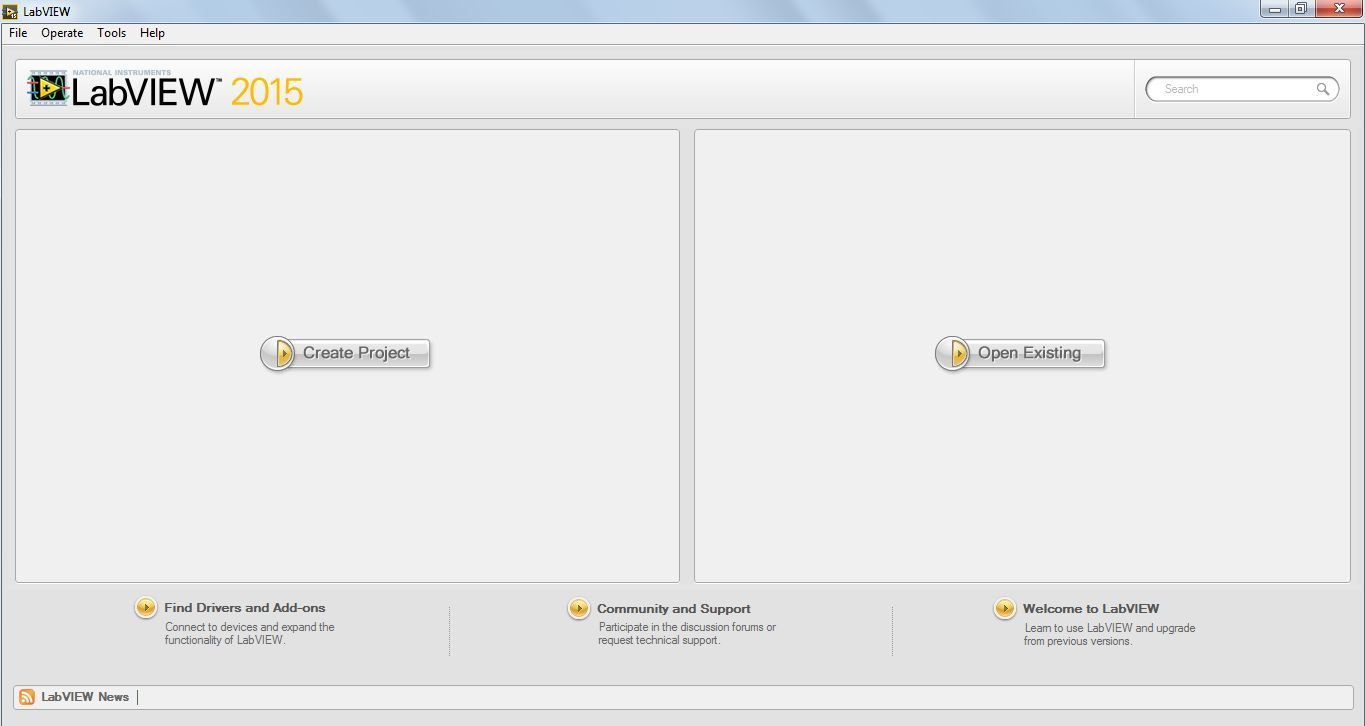
When we start LabVIEW for first time; the following is the screen we come across. Two options are available
- Create Project (To start a new project from scratch).
- Open Existing (To open projects we have already created)
Click “Create Project”. The following screen appears.
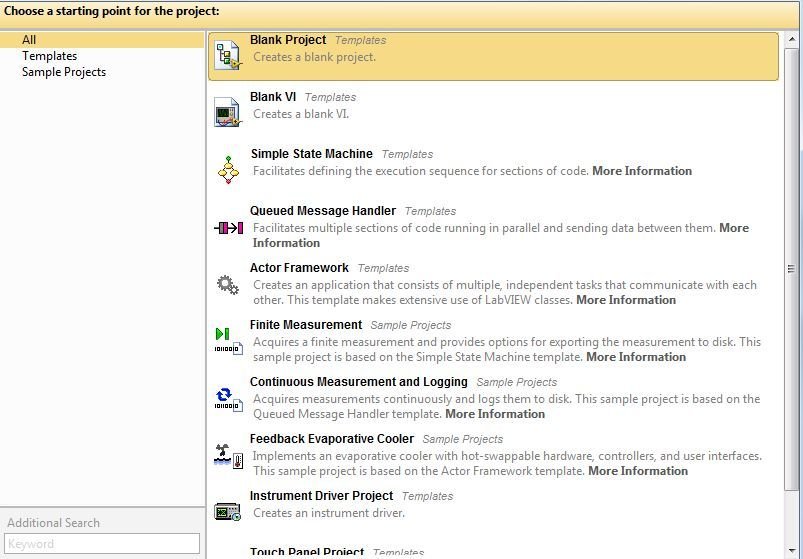
Select “Blank VI” and click “Finish”. VI stands for Virtual Instrument. The following screen appears:
- Front Panel (It is the area where we place different graphical blocks for our design. It is a user interface).
- Block Diagram (It is a graphical source code. Data travels on wires from control terminals through functions to indicator terminals. Block executes by data flow.)
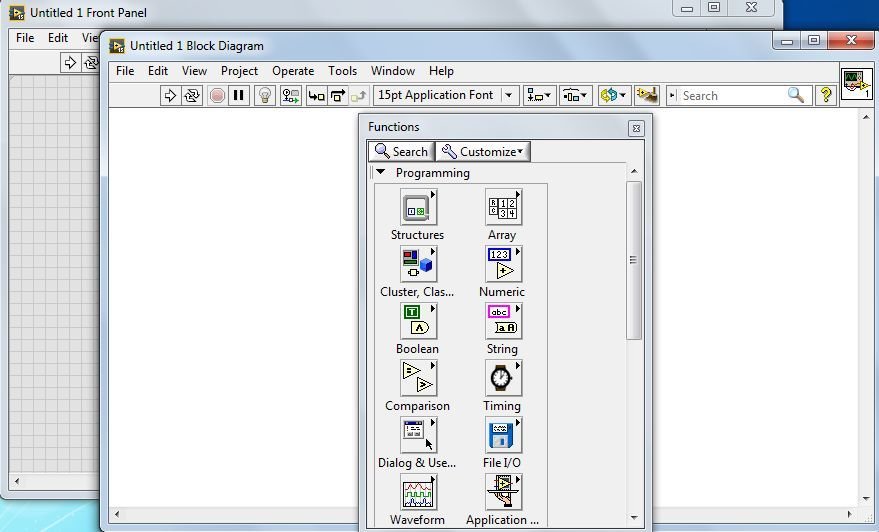
- Functions (It appears when you click on the “block diagram” screen. It contains different control instruments for the “block diagram”.)
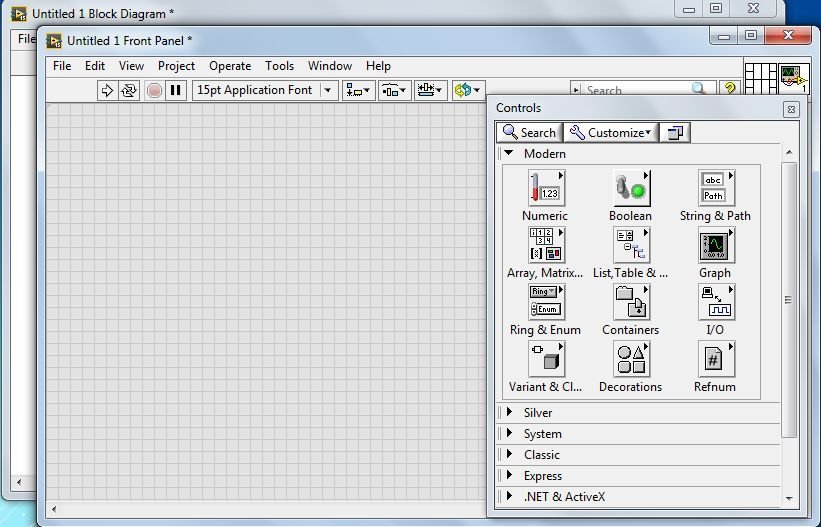
- Controls (It appears when you click on the “front panel” screen. It contains different control instruments for the “front panel”. It is not shown in the picture.)
Click on the front panel and select “Booleans” from the “controls” screen. This screen also contains many other options. We will explore them in further tutorials. For the time being, select “Boolean” which contains different devices for input and output.
On selecting “Boolean” the following screen appears
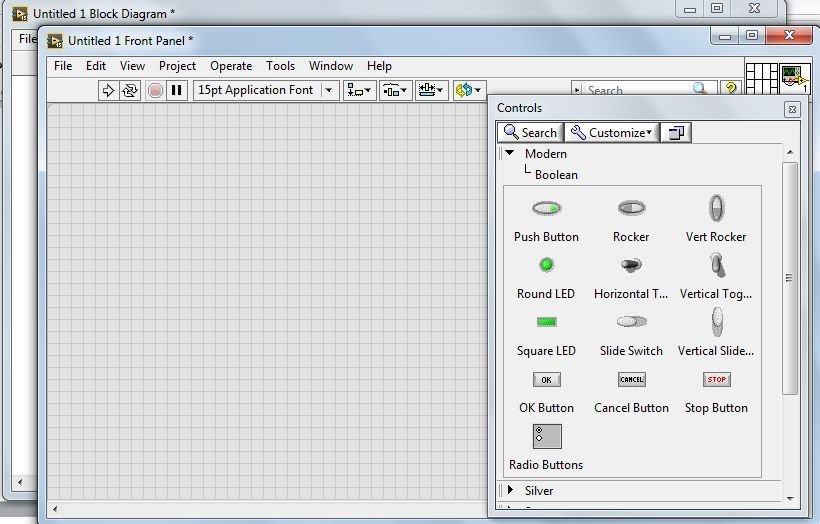
Drag “Push Button” and “Round LED” to “Front Panel”.

Now click on “Block diagram”. You will see the following screen.
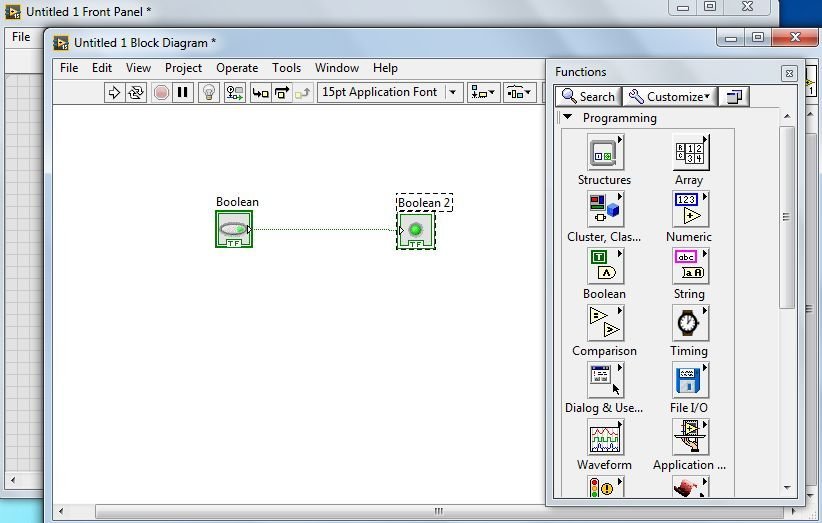
Bring the cursor near the arrow on the “Boolean” block diagram, and a wire will appear. Connect “Boolean” with “Boolean2” using the wire.

After connecting both blocks with a wire, click on the “Front Panel” and then press the “Run Continuously” button (the two circular arrows), as shown in the figure.

Following is the screen that appears when you press the “Run Continuously” button. Please note the difference before and after pressing the button. The picture above shows the state before pressing the button.

Now, when we click on the “Boolean” push button, it turns the “Boolean2” LED on.

To stop a running program and return to the editable window, press the red round button, i.e. “Abort Execution.”

In this way, we can perform different functions on designs.
LabVIEW has such a large number of functions that it is impossible to remember the purpose of every single control. To cope with this, click on “Help” and then on “Show Context Help”.
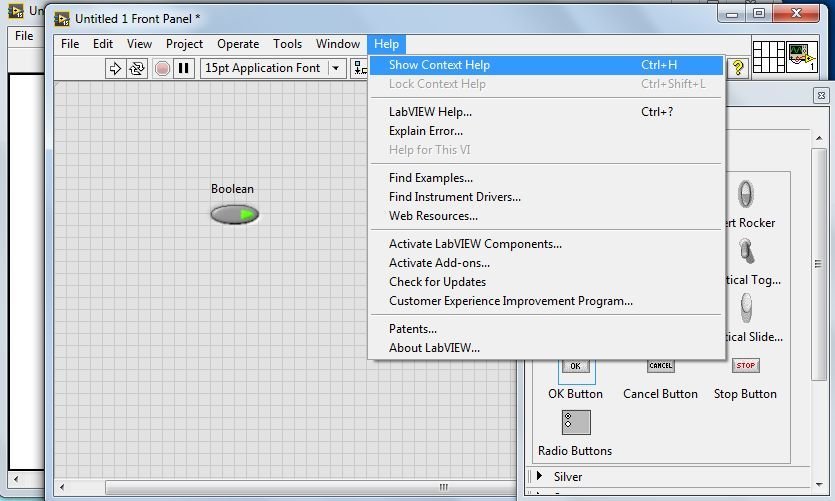
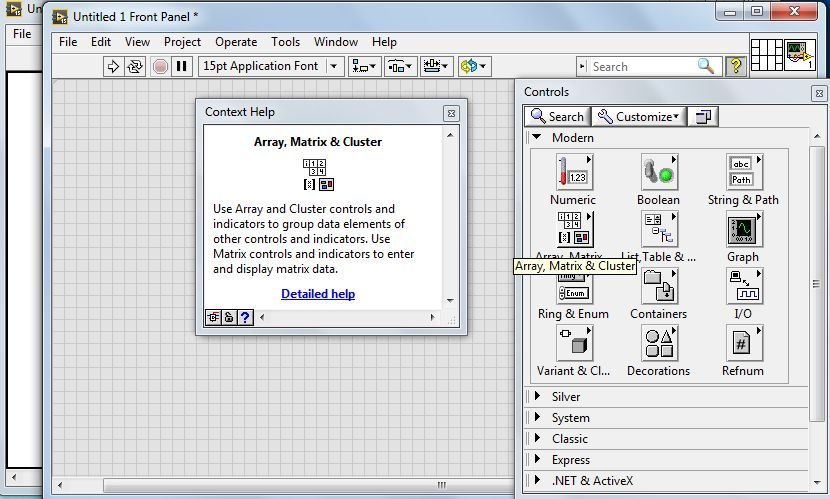
When you click “Show Help Context”, a dialogue box appears which gives a description of every element on which you hover the mouse pointer.
To save the design, go to “File” and choose “Save” or “Save As” according to your requirement. Files are saved using the “.vi” extension, and projects are saved using the “.lvproj” extension.

Now it’s your time to explore different functions of LabVIEW through this “Context Help” menu. Next time, I will come up with another interesting tutorial on LabVIEW programming.