In this user guide, we will build an ESP web server that will display sensor readings in real time through graphs. The sensor readings will be plotted after every 30 seconds in the form of a line chart. We will use Arduino IDE to program our ESP32/ESP8266 board which will be connected to a temperature, humidity, and pressure sensor. Our main aim is to transmit these sensor readings to our web server easily and interactively plot them in real time. For this purpose, we will use the Highcharts library. Any appropriate sensor can be used such as DS18B20, BME680, LM35, and MPU6050 but for this article, we will use a BME280 sensor which is used to measure temperature, pressure, and humidity.
In a previous article, we learned how to publish BME280 sensor readings to ThingSpeak using the ThingSpeak Arduino library and both the ESP32 and ESP8266 boards in real time. You can access the articles through the links given below:
- ESP32 Send Sensor Readings to ThingSpeak using Arduino IDE (BME280)
- ESP8266 NodeMCU Send Sensor Readings to ThingSpeak using Arduino IDE (BME280)
However, in this article, we will build our own ESP asynchronous web server and plot the sensor data in individual charts.
We will cover the following content in this article:
- Project Overview
- Introduction to BME280 sensor
- Connecting BME280 sensor with the ESP32 and ESP8266 development boards
- Setting up Arduino IDE
- Arduino Sketch for plotting charts web server
- Demonstration
Plot Sensor Readings in Real Time Charts Project Overview
Our project revolves around the idea of building an ESP32/ESP8266 compatible web server which will display sensor readings accessed from the BME280 sensor. The three sensor readings: temperature, pressure, and humidity will be plotted individually in separate charts. We will use the Highcharts library to help us display the readings in a real time graph. The graphs will display sensor data on the y axis and time on the x-axis. Thus, we will be plotting temperature, humidity, and pressure readings over time in three separate graphs. The data points will increase after every 30 seconds to a maximum of 40 data points.
Additionally, we will create and store the HTML file through which we will build our web server in the ESP’s filesystem (SPIFFS). To have a detailed look at how to create ESP web servers using SPIFFS, you can have a look at our previous articles:
- ESP32 Web Server with SPIFFS (SPI Flash File System)
- ESP8266 NodeMCU Web Server using LittleFS (Flash File System)
- Displaying Images in ESP32 and ESP8266 Web Server
BME280 Sensor Introduction
The BME280 sensor is used to measure readings regarding ambient temperature, barometric pressure, and relative humidity. It is mostly used in web and mobile applications where low power consumption is key. This sensor uses I2C or SPI to communicate data with the micro-controllers. Although there are several different versions of BME280 available in the market, the one we will be studying uses the I2C communication protocol and SPI.
I2C means Inter-Integrated Circuit and works on the principle of the synchronous, multi-master multi-slave system. With BME280 and the ESP boards, the ESP32 acts as a master, and the BME280 sensor as a slave because it is an external device, acts as a slave. The ESP development boards communicate with the BME280 sensor through the I2C protocol to get temperature, barometric pressure, and relative humidity.
Connecting BME280 sensor with the ESP32/ESP8266 development board
The connection of BME280 with the ESP boards is very easy. We have to connect the VCC terminal with 3.3V, ground with the ground (common ground), SCL of the sensor with SCL of the module, and SDA of the sensor with the SDA pin of the ESP modules.
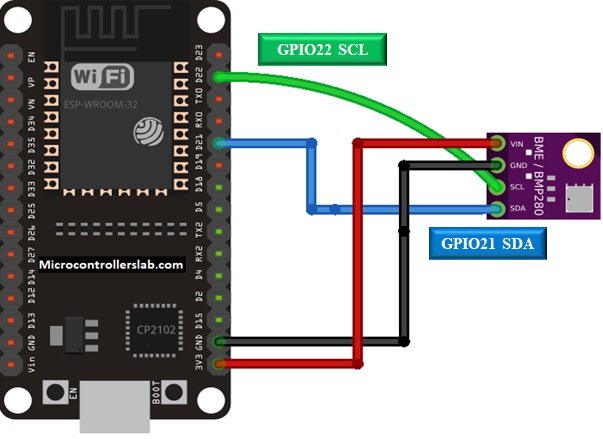
The I2C pin in ESP32 for SDA is GPIO21 and for SCL is GPIO22. For ESP8266 the default I2C pins for SDA are GPIO4 and for SCL are GPIO5.
Required Components:
We will need the following components to connect our ESP board with the BME280 sensor.
- ESP32 or ESP8266 board
- BME280 Sensor
- Connecting Wires
- Breadboard
Schematic Diagram
Follow the schematic diagrams below for both the ESP modules and connect them accordingly. If you are using ESP32 for this project, connect the ESP32 device with BME280 as shown in the schematic diagram below:
Similarly, if you are using ESP8266 NodeMCU for this project, connect the ESP8266 device with BME280 as shown in the schematic diagram below:
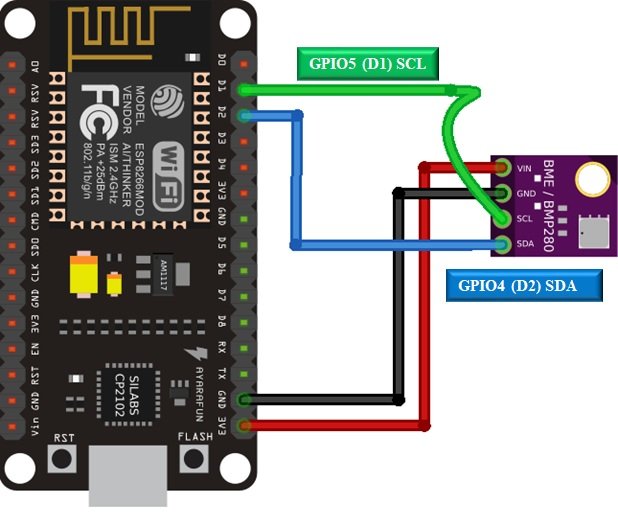
In some BME280 sensors, the SCK terminal means the SCL pin. Likewise, the SDI terminal means the SDA pin. Vin is connected with a 3.3V pin on the module and both the ESP board and the sensor is commonly grounded.
You may also like to read BM280 related guides:
- BME280 with Arduino: Display Readings on OLED ( Arduino IDE)
- MicroPython: BME280 with ESP32 and ESP8266
- BME280 with ESP8266 NodeMCU – Display Values on OLED ( Arduino IDE)
- MicroPython: BME280 Web Server with ESP32/ESP8266 (Weather Station)
- BME280 with ESP32 – Display Values on OLED ( Arduino IDE)
Setting up Arduino IDE
We will use Arduino IDE to program our ESP32/ESP8266 development board. Thus, you should have the latest version of Arduino IDE. Additionally, you also need to install the ESP32 and the ESP8266 plugin. If your IDE does not have the plugins installed you can visit the link below:
Installing ESP32 library in Arduino IDE and upload code.
Installing ESP8266 library in Arduino IDE
Filesystem Uploader Plugin
Also, you will have to download and install the ESP32/ESP8266 Filesystem Uploader Plugin in your Arduino IDE. If you are using the ESP32 board follow the link below to upload the SPIFFS files on your board.
Install ESP32 Filesystem Uploader in Arduino IDE – SPIFFS
If you are using the ESP8266 NodeMCU board follow the link below to upload the LittleFS files on your board.
LittleFS Introduction & Install ESP8266 NodeMCU Filesystem Uploader in Arduino IDE
Installing Libraries
Installing ESPAsyncWebServer Library and Async TCP/ ESP Async TCP Library
We will build our asynchronous web server with the help of the ESPAsycWebServer library.
We will need two libraries to build our web server.
- ESPAsyncWebServer & AsyncTCP for ESP32.
- ESPAsyncwebServer & ESPAsyncTCP for ESP8266.
The ESPAsyncWebServer library will help us in creating our web server easily. With this library, we will set up an asynchronous HTTP server. AsyncTCP (for ESP32 only) and ESPAsyncTCP (for ESP8266 only) library will also be incorporated as it a dependency for the ESPAsyncWebServer library. All of these libraries are not available in the Arduino library manager. Therefore, we will have to download and load them on our ESP32/ESP8266 board ourselves.
For ESP32 & ESP8266:
- To install the ESPAsyncWebServer library for free, click here to download. You will download the library as a .zip folder which you will extract and rename as ‘ESPAsyncWebServer.’ Then, transfer this folder to the installation library folder in your Arduino IDE.
For ESP32 Only:
- To install the Async TCP library for free, click here to download. You will download the library as a .zip folder which you will extract and rename as ‘AsyncTCP.’ Then, transfer this folder to the installation library folder in your Arduino IDE.
For ESP8266 Only:
- To install the ESPAsync TCP library for free, click here to download. You will download the library as a .zip folder which you will extract and rename as ‘ESPAsyncTCP.’ Then, transfer this folder to the installation library folder in your Arduino IDE.
Likewise, you can also go to Sketch > Include Library > Add .zip Library inside the IDE to add the libraries as well. After installation of the libraries, restart your IDE.
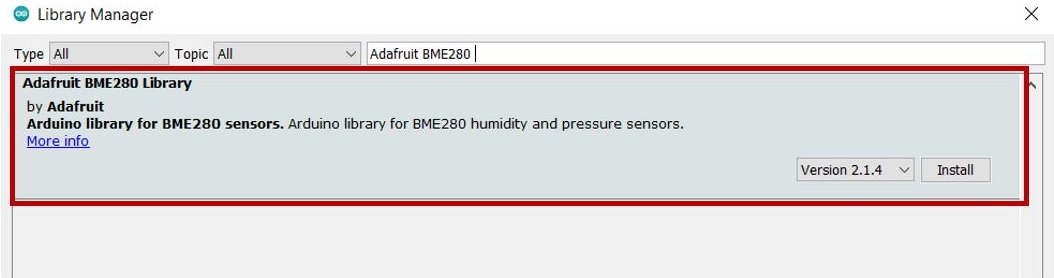
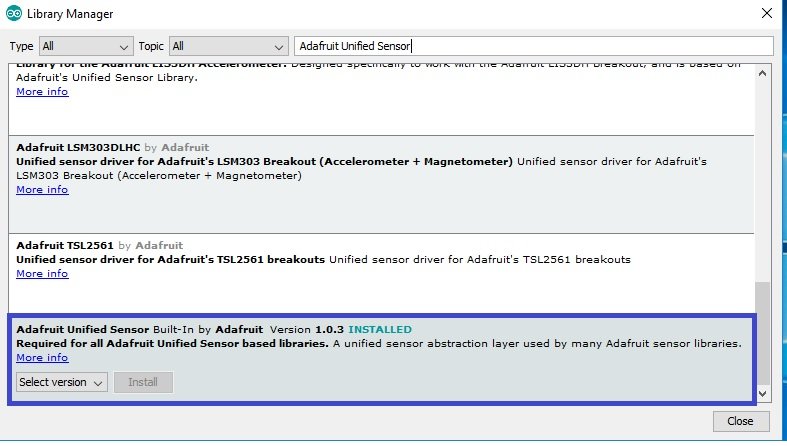
Installing BME280 Libraries
As we are connecting the BME280 sensor with ESP32/ESP8266 so we will have to install BME280 libraries to our module. We will require two sensor libraries for this project:
- Adafruit_BME280 library
- Adafruit_Sensor library
We will use the Library Manager in our Arduino IDE to install the latest versions of the libraries. Open your Arduino IDE and go to Sketch > Include Libraries > Manage Libraries. Type each library name in the search bar and install them both.
Creating HTML File for SPIFFS
In most of our web server projects with ESP32 and ESP8266, we have included HTML and CSS files inside our Arduino sketch. We save these HTML documents inside Arduino sketch by converting them into strings. Whenever a web client makes an HTTTP request, we send this string as a response which is basically a web page.
On the contrary, with SPIFFS, we can save HTML, CSS, and Javascript files in ESP flash file system. Whenever a web client makes an HTTTP request, we can serve these files directly from SPIFFS.
To build our ESP web server using SPIFFS, we will create the HTML file and the Arduino sketch and organize them in a project folder like shown below:

Note: You should place HTML file inside the data folder. Otherwise, SPIFFS library will not be able to read this file.
Creating HTML file
Inside our HTML file, we will include the titles and build charts via the Highcharts library. We are including both CSS and JavaScript to build the web server inside this file.
Now create an index.html file and replicate the code given below in that file.
<head>
  <meta name="viewport" content="width=device-width, initial-scale=1">
  https://code.highcharts.com/highcharts.js
  <style>
    body {
      min-width: 310px;
    	max-width: 800px;
    	height: 400px;
      margin: 0 auto;
    }
    h2 {
      font-family: New Times Roman;
      font-size: 3.0rem;
      text-align: center;
    }
  </style>
</head>
<body>
  <h2>BME280 Sensor Readings</h2>
  <div id="chart-temperature" class="container"></div>
  <div id="chart-humidity" class="container"></div>
  <div id="chart-pressure" class="container"></div>
</body>
<script>
var chartT = new Highcharts.Chart({
  chart:{ renderTo : 'chart-temperature' },
  title: { text: 'BME280 Temperature Readings' },
  series: [{
    showInLegend: false,
    data: []
  }],
  plotOptions: {
    line: { animation: false,
      dataLabels: { enabled: true }
    },
    series: { color: '#FF0000' }
  },
  xAxis: { type: 'datetime',
    dateTimeLabelFormats: { second: '%H:%M:%S' }
  },
  yAxis: {
    title: { text: 'Temperature (Celsius)' }
  },
  credits: { enabled: false }
});
setInterval(function ( ) {
  var xhttp = new XMLHttpRequest();
  xhttp.onreadystatechange = function() {
    if (this.readyState == 4 && this.status == 200) {
      var x = (new Date()).getTime(),
          y = parseFloat(this.responseText);
      if(chartT.series[0].data.length > 40) {
        chartT.series[0].addPoint([x, y], true, true, true);
      } else {
        chartT.series[0].addPoint([x, y], true, false, true);
      }
    }
  };
  xhttp.open("GET", "/temperature", true);
  xhttp.send();
}, 30000 ) ;

var chartH = new Highcharts.Chart({
  chart:{ renderTo:'chart-humidity' },
  title: { text: 'BME280 Humidity Readings' },
  series: [{
    showInLegend: false,
    data: []
  }],
  plotOptions: {
    line: { animation: false,
      dataLabels: { enabled: true }
    }
  },
  xAxis: {
    type: 'datetime',
    dateTimeLabelFormats: { second: '%H:%M:%S' }
  },
  yAxis: {
    title: { text: 'Humidity (%)' }
  },
  credits: { enabled: false }
});
setInterval(function ( ) {
  var xhttp = new XMLHttpRequest();
  xhttp.onreadystatechange = function() {
    if (this.readyState == 4 && this.status == 200) {
      var x = (new Date()).getTime(),
          y = parseFloat(this.responseText);
      if(chartH.series[0].data.length > 40) {
        chartH.series[0].addPoint([x, y], true, true, true);
      } else {
        chartH.series[0].addPoint([x, y], true, false, true);
      }
    }
  };
  xhttp.open("GET", "/humidity", true);
  xhttp.send();
}, 30000 ) ;

var chartP = new Highcharts.Chart({
  chart:{ renderTo:'chart-pressure' },
  title: { text: 'BME280 Pressure Readings' },
  series: [{
    showInLegend: false,
    data: []
  }],
  plotOptions: {
    line: { animation: false,
      dataLabels: { enabled: true }
    },
    series: { color: '#3338FF' }
  },
  xAxis: {
    type: 'datetime',
    dateTimeLabelFormats: { second: '%H:%M:%S' }
  },
  yAxis: {
    title: { text: 'Pressure (hPa)' }
  },
  credits: { enabled: false }
});
setInterval(function ( ) {
  var xhttp = new XMLHttpRequest();
  xhttp.onreadystatechange = function() {
    if (this.readyState == 4 && this.status == 200) {
      var x = (new Date()).getTime(),
          y = parseFloat(this.responseText);
      if(chartP.series[0].data.length > 40) {
        chartP.series[0].addPoint([x, y], true, true, true);
      } else {
        chartP.series[0].addPoint([x, y], true, false, true);
      }
    }
  };
  xhttp.open("GET", "/pressure", true);
  xhttp.send();
}, 30000 ) ;
</script>
</html>
We will first create a meta tag to make sure our web server is available for all browsers e.g., smartphones, laptops, computers etc.
<meta name="viewport" content="width=device-width, initial-scale=1">To create the graphs we will use the Highcharts library. The first step is to include this library in our html script.
https://code.highcharts.com/highcharts.jsNext we will include the styling of the web page. We have the <style></style> tags which mark the beginning and end of the CSS styling. For the body of the web page, the dimensions of the web page and positioning are specified. We will also indicate the font type, size, and positioning for the heading of the web server indicated by h2. Below you can view the styling which we have incorporated:
<style>
    body {
      min-width: 310px;
    	max-width: 800px;
    	height: 400px;
      margin: 0 auto;
    }
    h2 {
      font-family: New Times Roman;
      font-size: 3.0rem;
      text-align: center;
    }
  </style>
The next step will be to define the HTML web page body. This will go inside the <body></body> tags which mark the beginning and the ending of the script. This part will include the heading of the web page and the charts. We will include the heading of our webpage inside the <h2></h2> tags and it will be ‘BME280 Sensor Readings.’ You can use any other heading as you prefer.
<h2>BME280 Sensor Readings</h2>Next, we will specify a <div> for each graph with its unique id. As we are creating three charts thus we will create three separate <div> sections for each sensor reading individually.
<div id="chart-temperature" class="container"></div>
<div id="chart-humidity" class="container"></div>
<div id="chart-pressure" class="container"></div>
JavaScript
We will use JavaScript to create three separate charts and display the sensor data for each individually. The following section of code creates the chart for the temperature readings by accessing its unique id ‘chart-temperature’ which we previously defined above. We will specify all the necessary details to create the chart like title, axis labels, colour of the line chart, etc.
var chartT = new Highcharts.Chart({
  chart:{ renderTo : 'chart-temperature' },
  title: { text: 'BME280 Temperature Readings' },
  series: [{
    showInLegend: false,
    data: []
  }],
  plotOptions: {
    line: { animation: false,
      dataLabels: { enabled: true }
    },
    series: { color: '#FF0000' }
  },
  xAxis: { type: 'datetime',
    dateTimeLabelFormats: { second: '%H:%M:%S' }
  },
  yAxis: {
    title: { text: 'Temperature (Celsius)' }
  },
  credits: { enabled: false }
});
Then we will create setInterval() function which will access temperature readings from the ESP board connected with BME280 sensor after every 30 seconds. This is done by making an HTTP GET request to the ESP module regarding the sensor data. It will create the HTTP GET request after every 30 seconds.
setInterval(function ( ) {
  var xhttp = new XMLHttpRequest();
  xhttp.onreadystatechange = function() {
    if (this.readyState == 4 && this.status == 200) {
      var x = (new Date()).getTime(),
          y = parseFloat(this.responseText);
      if(chartT.series[0].data.length > 40) {
        chartT.series[0].addPoint([x, y], true, true, true);
      } else {
        chartT.series[0].addPoint([x, y], true, false, true);
      }
    }
  };
  xhttp.open("GET", "/temperature", true);
  xhttp.send();
}, 30000 ) ;
Inside this function we use the XMLHttpRequest. This will allow us to make an HTTP request in JavaScript. To make the HTTP GET request to we will follow three steps:
Firstly, we will create an XMLHttpRequest as follows:
var xhttp = new XMLHttpRequest();Secondly, we will initialize the request by using the xhttp.open() method. Inside it we will pass on three arguments. The first argument specifies the type of HTTP method which is GET in our case. The second argument is the URL to which are ESP32/ESP8266 will request upon. In our case, it will be /temperature. The last argument is true which specifies that the request is asynchronous.
xhttp.open("GET", "/temperature", true);Lastly, we will use xhttp.send() to open the connection. Our server (ESP32/ESP8266) will now be able to receive the HTTP GET request whenever the 30 seconds mark will be up.
xhttp.send();Likewise, we will create similar charts for humidity and pressure by accessing their unique ids: chart-humidity and chart-pressure. In these cases, we will request upon /humidity and /pressure URLs respectively to access the sensor data for each category.
Arduino Sketch ESP Sensor Readings Charts Web Server
Open your Arduino IDE and go to File > New to open a new file. Copy the code given below in that file. Save it as Async_ESP_Graphs_Web_Server. This code will work for both ESP32 and ESP8266 development boards. You just need to enter your network credentials.
#ifdef ESP32
  #include <WiFi.h>
  #include <ESPAsyncWebServer.h>
  #include <SPIFFS.h>
#else
  #include <Arduino.h>
  #include <ESP8266WiFi.h>
  #include <Hash.h>
  #include <ESPAsyncTCP.h>
  #include <ESPAsyncWebServer.h>
  #include <FS.h>
#endif
#include <Wire.h>
#include <Adafruit_Sensor.h>
#include <Adafruit_BME280.h>

Adafruit_BME280 bme;

const char* ssid = "PTCL-BB";  //Write your SSID
const char* password = "********";    //Write your Password

AsyncWebServer server(80);

String read_temperature() {
  float temp = bme.readTemperature();
  if (isnan(temp)) {
    Serial.println("Failed to read from BME280 sensor!");
    return "";
  }
  else {
    Serial.println(temp);
    return String(temp);
  }
}

String read_humidity() {
  float hum = bme.readHumidity();
  if (isnan(hum)) {
    Serial.println("Failed to read from BME280 sensor!");
    return "";
  }
  else {
    Serial.println(hum);
    return String(hum);
  }
}

String read_pressure() {
  float pres = bme.readPressure() / 100.0F;
  if (isnan(pres)) {
    Serial.println("Failed to read from BME280 sensor!");
    return "";
  }
  else {
    Serial.println(pres);
    return String(pres);
  }
}

void setup(){
  Serial.begin(115200);

  bool status;
  status = bme.begin(0x76);
  if (!status) {
    Serial.println("BME280 not connected properly. Check circuit!");
    while (1);
  }

  if(!SPIFFS.begin()){
    Serial.println("An Error has occurred while mounting SPIFFS");
    return;
  }

  WiFi.begin(ssid, password);
  while (WiFi.status() != WL_CONNECTED) {
    delay(1000);
    Serial.println("Connecting to WiFi..");
  }
  Serial.println("IP Address: ");
  Serial.println(WiFi.localIP());

  server.on("/", HTTP_GET, [](AsyncWebServerRequest *request){
    request->send(SPIFFS, "/index.html");
  });
  server.on("/temperature", HTTP_GET, [](AsyncWebServerRequest *request){
    request->send_P(200, "text/plain", read_temperature().c_str());
  });
  server.on("/humidity", HTTP_GET, [](AsyncWebServerRequest *request){
    request->send_P(200, "text/plain", read_humidity().c_str());
  });
  server.on("/pressure", HTTP_GET, [](AsyncWebServerRequest *request){
    request->send_P(200, "text/plain", read_pressure().c_str());
  });

  server.begin();
}

void loop(){

}
How Code Works?
Now, let us understand how each part of the code works.
Including Libraries
The code starts with including all the necessary libraries which are needed for the proper functionality of the code. . As this code is compatible with both ESP32 and ESP8266 thus both libraries (WiFi.h and ESP8266WiFi.h) are defined. This library will help in establishing the connection between our ESP module to a wireless network. We will also import the two libraries which we installed previously, the ESPAsyncWebServer library and the ESPAsyncTCP library. The Wire.h will allow us to communicate through the I2C protocol for the BME280 sensor. The Adafruit_Sensor and the Adafruit_BME280 libraries which we installed in Arduino IDE earlier are also included as they are necessary to interface with the sensor. Also, the SPIFFS library will allow us to access the flash memory file system of our ESP32/ESP8266 core.
#ifdef ESP32
  #include <WiFi.h>
  #include <ESPAsyncWebServer.h>
  #include <SPIFFS.h>
#else
  #include <Arduino.h>
  #include <ESP8266WiFi.h>
  #include <Hash.h>
  #include <ESPAsyncTCP.h>
  #include <ESPAsyncWebServer.h>
  #include <FS.h>
#endif
#include <Wire.h>
#include <Adafruit_Sensor.h>
#include <Adafruit_BME280.h>
Defining BME280 Object
Then, we will define the Adafruit_BME280 object named bme by setting it on the default I2C GPIO pins.
Adafruit_BME280 bme;Setting Network Credentials
Next, we will create two global variables, one for the SSID and another for the password. These will hold our network credentials which will be used to connect to our wireless router. Replace both of them with your credentials to ensure a successful connection.
const char* ssid = "PTCL-BB";  //Write your SSID
const char* password = "********";    //Write your Password
Creating the AsyncWebServer Object
The AsyncWebServer object will be used to set up the ESP web server. We will pass the default HTTP port which is 80, as the input to the constructor. This will be the port where the server will listen to the requests.
AsyncWebServer server(80);Accessing Sensor Data
Now we will create a read_temperature() function which will access the temperature reading from BME280. Through bme.readTemperature(), the sensor reading will get saved in the variable ‘temp.’ This value will get displayed in the serial monitor as well.
String read_temperature() {
  float temp = bme.readTemperature();
  if (isnan(temp)) {
    Serial.println("Failed to read from BME280 sensor!");
    return "";
  }
  else {
    Serial.println(temp);
    return String(temp);
  }
}
Similarly, we will create a read_humidity() function which will access the humidity reading from BME280. Through bme.readHumidity(), the sensor reading will get saved in the variable ‘hum.’ This value will get displayed in the serial monitor as well.
String read_humidity() {
  float hum = bme.readHumidity();
  if (isnan(hum)) {
    Serial.println("Failed to read from BME280 sensor!");
    return "";
  }
  else {
    Serial.println(hum);
    return String(hum);
  }
}
Likewise, we will create a read_pressure() function which will access the pressure reading from BME280. Through bme.readPressure(), the sensor reading will get saved in the variable ‘pres.’ This value will get displayed in the serial monitor as well.
String read_pressure() {
  float pres = bme.readPressure() / 100.0F;
  if (isnan(pres)) {
    Serial.println("Failed to read from BME280 sensor!");
    return "";
  }
  else {
    Serial.println(pres);
    return String(pres);
  }
}
setup()
Inside the setup() function, we will open a serial connection at a baud rate of 115200.
Serial.begin(115200);Initializing Sensor & SPIFFS
The following lines of code will initialize the BME280 sensor. If the connection between the module and the sensor is incorrect, it will print that message on the serial monitor: “BME280 not connected properly. Check circuit!”.
bool status;
  status = bme.begin(0x76);
  if (!status) {
    Serial.println("BME280 not connected properly. Check circuit!");
    while (1);
  }
These lines of code will initialize the SPIFFS.
 if(!SPIFFS.begin()){
    Serial.println("An Error has occurred while mounting SPIFFS");
    return;
  }
Connecting to Wi-Fi
The following section of code will connect our ESP32/ESP8266 board with the local network whose network credentials we already specified above. After the connection will be established, the IP address of the ESP32 board will get printed on the serial monitor. This will help us to make a request to the server.
WiFi.begin(ssid, password);
  while (WiFi.status() != WL_CONNECTED) {
    delay(1000);
    Serial.println("Connecting to WiFi..");
  }
  Serial.println("IP Address: ");
  Serial.println(WiFi.localIP());
Handling Requests
Now, we will look into how Asynchronous Web Server handles the http requests received from a client. We can configure the Asynchronous Web Server to listen to specific HTTP requests based on configured routes and execute particular function whenever a HTTP request is received on that route.
We will use the on() method on the server object to listen to the incoming HTTP requests and execute functions accordingly. The send() method uses to return the HTTP response. The index.html file which is saved in the SPIFFS will send to the client, whenever the server will receive a request on the “/” URL.
server.on("/", HTTP_GET, [](AsyncWebServerRequest *request){
    request->send(SPIFFS, "/index.html");
  });
Likewise, when the server will receive a request on the /temperature, /humidity and /pressure URL then we will call their respective functions which we defined above. These will return the current sensor readings. The send_P() method will be used to return the HTTP response. It takes in three parameters. The first parameter is the response code which we will specify as 200. It is the HTTP response code for ok. The second parameter is the content type of the response which we will specify as “text/plain” and the third parameter is the function which will return the sensor reading for each category respectively.
 server.on("/temperature", HTTP_GET, [](AsyncWebServerRequest *request){
    request->send_P(200, "text/plain", read_temperature().c_str());
  });

  server.on("/humidity", HTTP_GET, [](AsyncWebServerRequest *request){
    request->send_P(200, "text/plain", read_humidity().c_str());
  });

  server.on("/pressure", HTTP_GET, [](AsyncWebServerRequest *request){
    request->send_P(200, "text/plain", read_pressure().c_str());
  });
To start the server, we will call begin() on our server object.
server.begin();loop()
The loop() function will be empty as the web server is asynchronous in nature.
Plot Sensor Readings in Real Time Charts Demonstration
After you have saved both the files go to Sketch > Show Sketch Folder and create a new folder. Place the HTML file inside that folder and save the folder as ‘data.’
Make sure you choose the correct board and COM port before uploading your code to the board. Go to Tools > Board and select ESP32 Dev Module or NodeMCU 1.0. Next, go to Tools > Port and select the appropriate port through which your board is connected. In this case, we are using ESP32 development board.
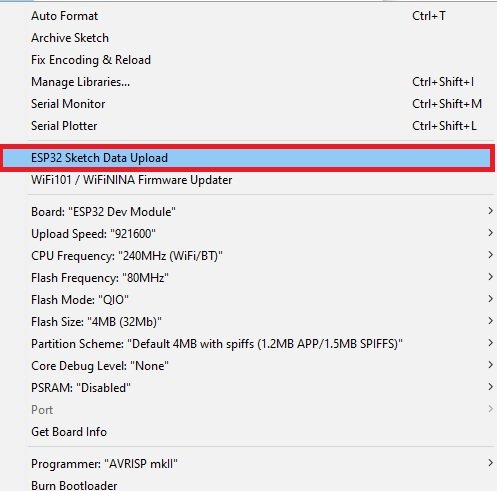
Now, we will upload the files into our ESP32 board. Go to Tools > ESP32 Data Sketch Upload. After a few moments, the file will be uploaded.
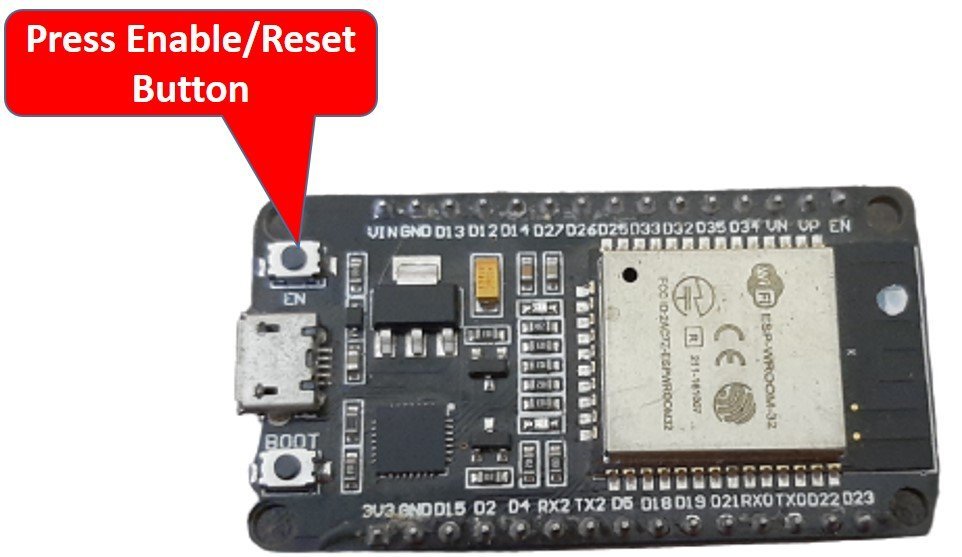
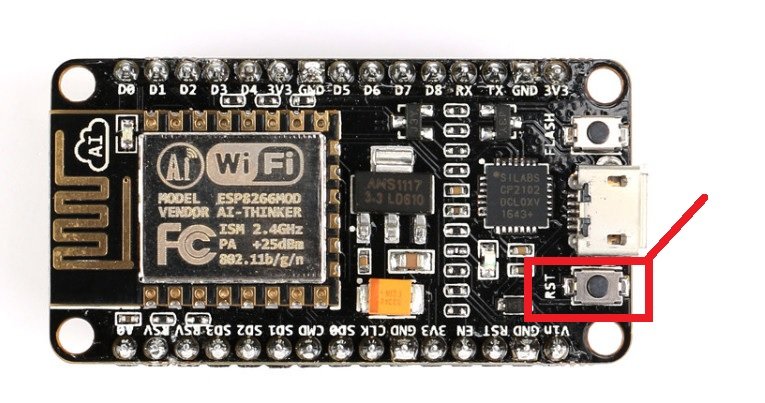
Click on the upload button to upload the code into the ESP32 development board. After you have uploaded your code to the ESP32/ESP8266 development board and the HTML file on SPIFFS press its ENABLE/RST button.
In your Arduino IDE, open up the serial monitor and you will be able to see the IP address of your ESP module. New sensor readings will also display after every 30 seconds.

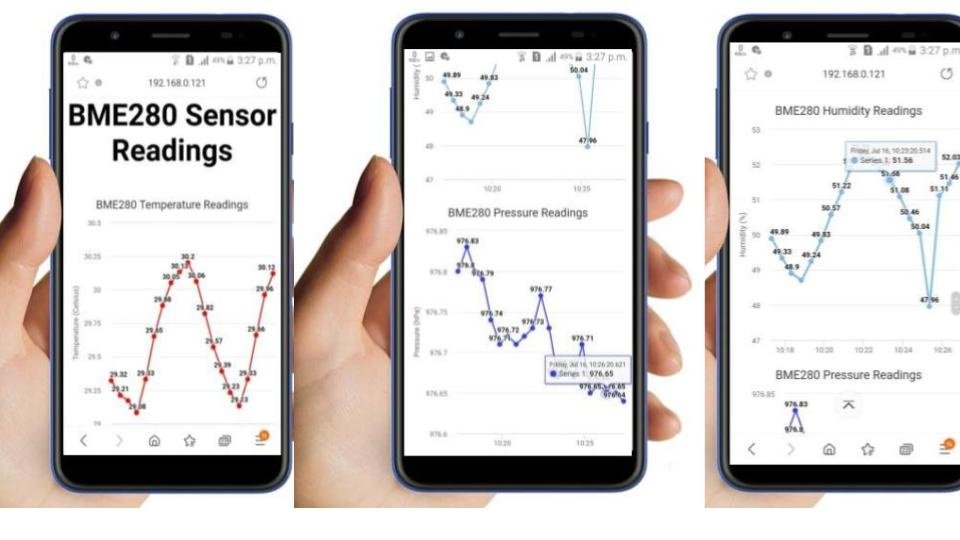
Type this IP Address in a new web browser and press enter. The web server will open. You will be able to see three separate charts for temperature, humidity and pressure readings against time.

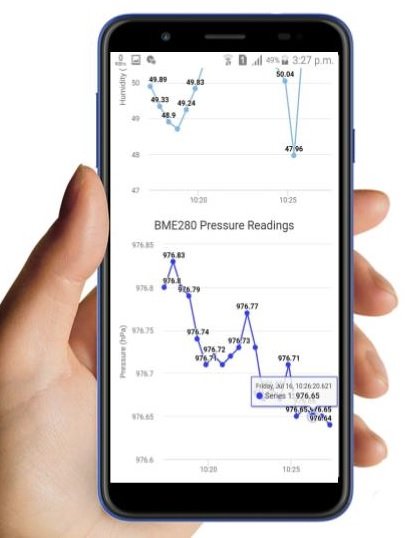
After every 30 seconds, new sensor readings will get included till a maximum of 40 data points. You can also view the exact timestamp of the reading by selecting the desired point. Below you can view the charts for temperature and humidity readings.

Below you can view the humidity and pressure readings chart. Notice how we can view the timestamp for the humidity value 57.29%.

You can also view readings on mobile:


Conclusion
In conclusion, we have learned how to create an ESP32/ESP8266 webserver that plots sensor readings on a web page in real time. You can access these sensor readings at any time and anywhere in the world through your web server. This tutorial is adaptable with any other suitable sensor as well. You just have to define the sensor and initialize it accordingly.
You may also like to read:
- ESP32/ESP8266 Thermostat Web Server – Control Output Based on Temperature Threshold
- ESP32 OTA (Over-The-Air) Updates using AsyncElegantOTA Library and Arduino IDE
- ESP32/ESP8266: Publish Sensor Readings to Google Sheets via IFTTT
- ESP8266 NodeMCU Send Sensor Readings to ThingSpeak using Arduino IDE (BME280)
the line
https://code.highcharts.com/highcharts.js
is this used during compile to “merge” highcharts.js into the flashed code, or is this called over the web ever time i look at the page?
If i compile this in my new york penthouse will it run ok at my offgrid cabin in the rockys?
(not that i have a penthouse, or could afford a cabin, and I’m in europe)
this is called over the web when a user makes a request by opening a web page with an IP address.
You can download the file, put it in SPIFFS, and reference it locally, then it won’t need the internet connection.