In this tutorial, we will discuss the significance of different data types used in LabVIEW and how they work. You might have noticed in previous tutorials that different data type blocks have different colors, such as pink for string type indicators and constants. After introducing the different data types, we have included an example program. Finally, we provide a mini-exercise for you to test your understanding of the concepts of data types.
Introduction to Data Types in LabVIEW
Data types, as the name suggests, represent the types of data or variables that can be used in LabView. A data type is a very important term to keep in mind while programming in LabVIEW. In a VI, every data type has a unique color that can’t be mixed or interconnected with others. For example, if a data variable is of type integer, then the indicator connected to display its value must also be of type integer; otherwise, the VI will give us an error or it may not connect the two blocks in the first place. If you have programming experience in any language, you must be familiar with the term data type. However, in this tutorial, we will start with the basics and explain a little about the data types.
In programming, the most common data types are Integer, Float, Boolean, Double, Array, and String. Whereas, in LabView, additional types, namely waveforms, and errors, are also introduced. Each data type can store only a specific type of data, i.e., an integer-type variable can only store and display integer data, and a string type can never be connected to a float indicator. Similarly, floating data types can only store floating-point data.
Programming Example of LabVIEW Data Types
Let’s now write a program that includes different data. Create a program using the information provided in Tutorial 1: Overview of LabVIEW and save it by using the path file>>save as or by pressing <Ctrl+S>.
Data Types in LabVIEW
Now on the Block Diagram, right-click to open the Function Palette, select Numeric, and then Numeric Constant. Now go to the Front Panel, right-click to open the Control Palette, select Numeric, and then Numeric Indicator.
If the color of the associated block of the indicator on the block diagram is blue, it shows that the indicator is of the integer type. But if it is other than blue, then we cannot connect it to a constant integer data type with this indicator in LabVIEW.
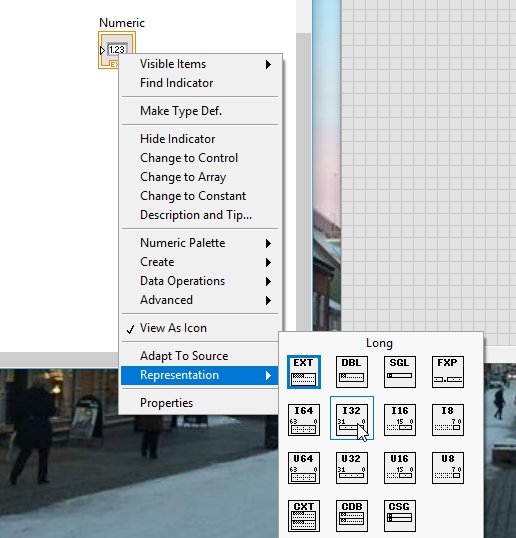
Right-click on the indicators block on the Block Diagram, select representations, and then select long, as shown in the figure below. This action will convert the indicator into an integer data type too.
Constant Integer Data Type with Indicator in LabVIEW
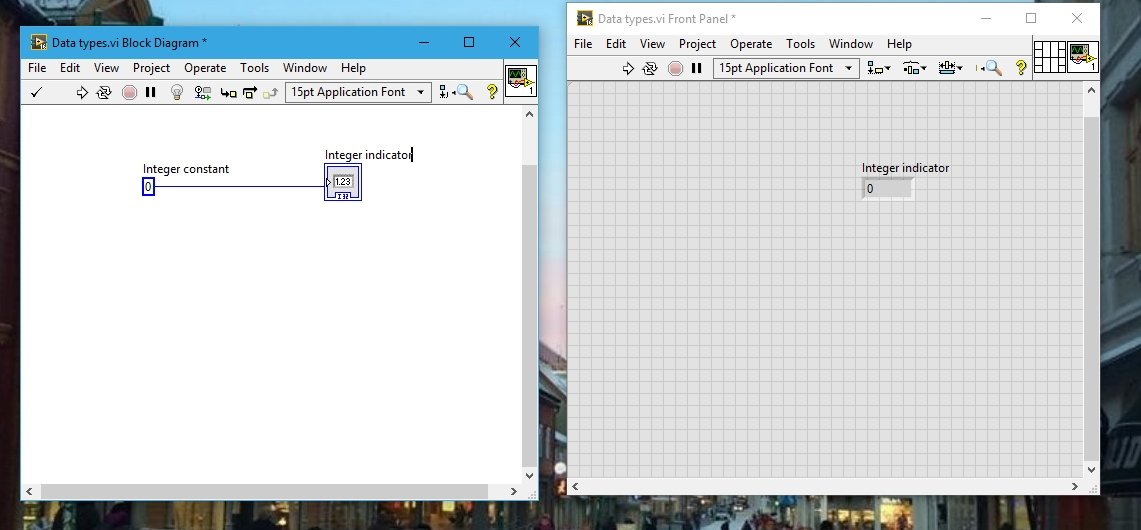
Now, connect the associated block of the numeric indicator on the block diagram with the numeric constant already present there through wires. The resulting diagram will look like the one shown in the figure below.
Floating Point and Double Data Type with Indicator in LabVIEW
Changing the value of the constant will change the display value of the indicator too. This was simple; now let’s see how to place floating point data type blocks. Float is also a numeric data type. Double and float are similar to each other; just float means generalized precision floating point data, whereas double means double precision floating point data.
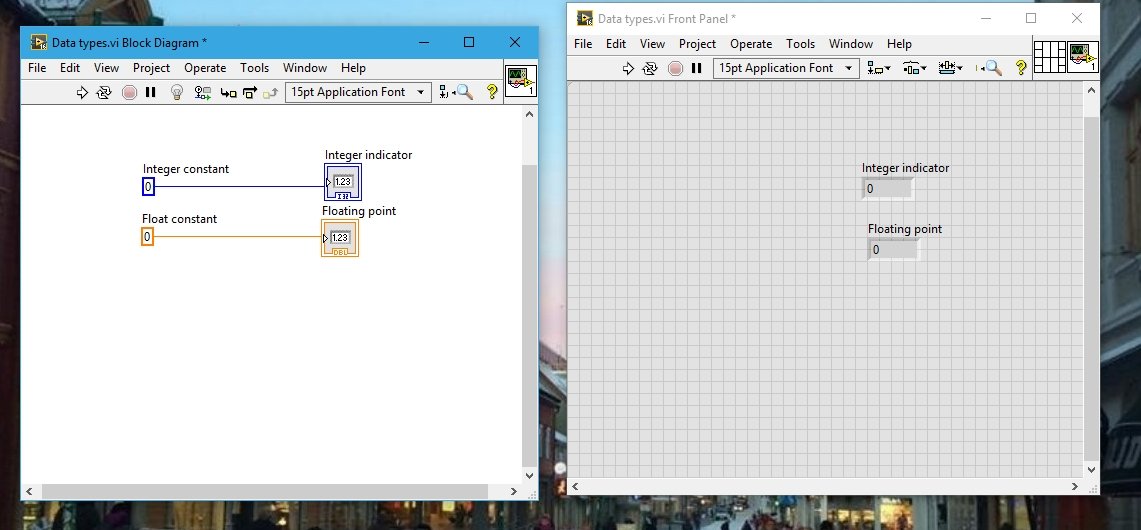
From the Function Palette, select Numeric and then Double Numeric Constant. Also, place a Numeric Indicator on the front panel to display its value. If both of the blocks are orange, connect them with a wire; otherwise, change the data type to double by right-clicking on the block, selecting representation, and then selecting double precision as described above for integers. The resulting diagram will look like the one shown in the figure below.
A string is also a data type. We have used string indicators and constants in previous tutorials. Let’s drop a string constant and an indicator along with these two block pairs.
Exercise on String Data Types in LabVIEW
Do yourself: Use your knowledge from the previous tutorials and place a string indicator and string constant on the same VI.
- After completing the above task, the VI will look like the one shown in the figure below.

NOTE: Always give labels to the blocks in order to remember the purpose or use of the block in the future.
Firstly, let’s see how to label a block. Right-click on the block that requires a label. Select visible and then check the label item in the dropdown menu. It will allow us to write the name or purpose above the block.
Boolean Data types in LabVIEW
Coming back to the data types in LabVIEW, another type of data is “Boolean”. Boolean is a logical type of data. It only gives output in the form of 0s and 1s, or false and true. If the output of a specific condition is true, i.e., the switch is on, a button is pressed, or the output of any condition is equal to 0 (Used in previous tutorials), then the Boolean indicator will give the data type output as true. From the control block on the Front Panel, select Boolean, and then select the vertical slide switch.

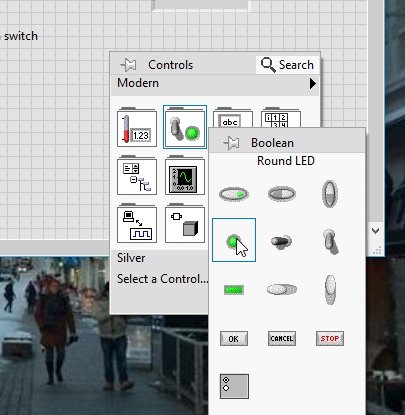
The purpose of this switch is to provide output as follows: a true (when the switch is on) and a false (when the switch is off) to the Boolean indicator. But where is the Boolean indicator? An LED can act as a Boolean indicator. From the Control Palette, select Boolean, and then select Round LED. This LED will turn on whenever we turn the switch on.
Connect the respective blocks of Boolean through a wire and label them accordingly, as shown in the figure.

Array Data Types in LabVIEW
Another data type is “Arrays”. We will not discuss them in detail because we have a separate tutorial about them, and you will learn about them in detail in the coming tutorials. The color of the array depends on the type of constants or data we want to store in it.
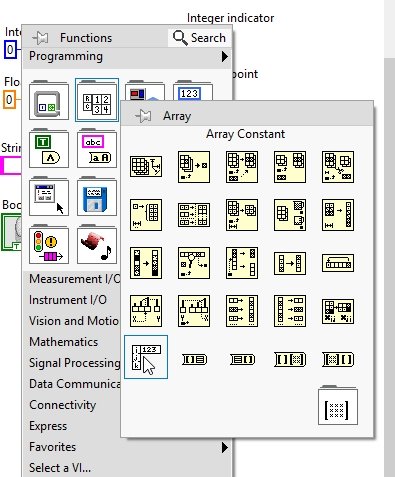
In an array, we can store integer, double, string, and boolean constants. Right now, we are using a double-type array. Don’t worry about how we did that; we will explain arrays in detail in the upcoming tutorial. Just skip it right now. See the figure below; it shows an array data type.
It will pop a respective indicator in the front panel. Right-click on the array block in the Front Panel, and from Numeric, select Numeric Constant and drop it inside the array block. Doing so will change the color of the associated array block in the block diagram.
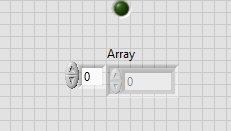
Now extend the size of the array in order to increase the number of elements in the array. For example.

To store a variable in an array, simply write in the blocks available on the array constant. So this is all about data types in LabVIEW.
Exercise
- Try to explore and use waveform data type by yourself.
Hint: You can use the waveform graph charts from the control palette in the waveform section or the waveform block from the function palette to fulfill the task. Don’t panic; we will be using graphs and charts in the upcoming tutorials.
Conclusion
In this tutorial, we have discussed the following topics:
In conclusion, this tutorial provided a comprehensive overview of data types in LabVIEW and their significance in programming. We explored the different types of data, including integers, floats, booleans, doubles, arrays, and strings, each with its unique characteristics and usage requirements. Through a LabVIEW programming example, we demonstrated how to incorporate various data types in a VI and manipulate them on the front panel and block diagram. Additionally, an exercise was included to test the understanding of string data types. By gaining a solid understanding of data types in LabVIEW, programmers can ensure the correct representation and manipulation of data, leading to robust and error-free applications.
Related Articles
You may also like to read:
- ESP32 Save Data to Flash Permanently using Preferences Library
- Calculate Factorial of a number in LabView: tutorial 35
- Displaying Images in ESP32 and ESP8266 Web Server
- UART Communication with Pic Microcontroller( Programming in MPLAB XC8 )
- piezoelectric sensor interfacing with Arduino Uno R3
- Arduino Uno Introduction, Pinout, Examples, Programming
This is it for today’s article. In case you face any issues or difficulties, let us know in the comment section below.
Dear sir,
Thanks for giving these articles, all they are important ..
Very good article it resolved all my queries thanks
Big Thanks Please give me code how to Print barcoce in TSC 247 Printer