In this ESP32/ESP8266 compatible guide, we will introduce you to InfluxDB and show you how to send DHT11/DHT22 sensor readings to the InfluxDB time-series database. We will show you how to create a database bucket and send ESP32/ESP8266 sensor data to the InfluxDB database. Moreover, we will also show you how to build your dashboard so that you are able to view your data in a more meaningful manner e.g. charts, graphs, etc. By the end of this tutorial, you will be able to know how to set up an ESP32/ESP8266 InfluxDB database and visualize the temperature and humidity readings acquired from DHT22 in a dashboard. One of the great features of using the InfluxDB database is that you can store your data in timestamps over a determined period of time. This makes it extremely handy to use in IoT projects where data logging with time is of importance.
Recommended Components
The following components are used in this project or are helpful for building it with the ESP32.
| Component | How it’s used in this project | Buy on Amazon |
|---|---|---|
| ESP32 Development Board | Reads the DHT sensor and sends the data to the InfluxDB database over Wi-Fi. | Check Price |
| ESP8266 NodeMCU | Alternative board that runs the same sketch and logs to InfluxDB. | Check Price |
| Micro USB Cable | Programs each board and powers it during testing. | Check Price |
| Breadboard | Holds the sensor and wiring without soldering. | Check Price |
| Jumper Wires | Connect the data and power lines to the sensor. | Check Price |
| DHT11 sensor | Measures temperature and humidity that are logged to InfluxDB. | Check Price |
| DHT22 sensor | Higher-accuracy alternative temperature and humidity sensor for logging. | Check Price |
As an Amazon Associate we earn from qualifying purchases. Prices and availability are accurate as of the date/time indicated and are subject to change.
InfluxDB Introduction
InfluxDB is an open-source time series database. It is used for storing and acquiring time series data commonly used in IoT applications, real time data analysis, operations monitoring etc. A vast amount of data can be efficiently stored every second with timestamps associated with each data point.
Let us define some InfluxDB key terms that are commonly used while using this database.
Bucket: A bucket is a specified place where the data is stored. While creating a bucket you specify the name and the time period for the data to get deleted.
Point: A point consists of a set of data in a row. It comprises of a measurement, tag set, field key, field value and a timestamp.
Tag (tag key and tag value): The columns in a data are known as tags. A tag consists of a set of data that gives us information about other data that are usually queried. Although they are optional but it helps in organizing the data in an efficient manner. They are indexed.
Field (field key and field value): A field consists of a field key and a field value stored in their respective columns. They are not indexed. Here a field key is a string type that depicts the name of the field. A field value on the other hand depicts the value of the field. It can be type string, float, int or boolean.
Measurement: This shows the data (tags, fields, timestamps) stored in the related fields. A measurement name is a string and is chosen in such a way that it describes the data it holds.
Recommended Reading: InfluxDB data elements
Setting up an InfluxDB Database
Now let us see how to easily set up our InfluxDB database for ESP32/ESP8266 data logging. Firstly, head over to the official InfluxDB website (https://www.influxdata.com/) and click the ‘Get InfluxDB’ button as highlighted below.

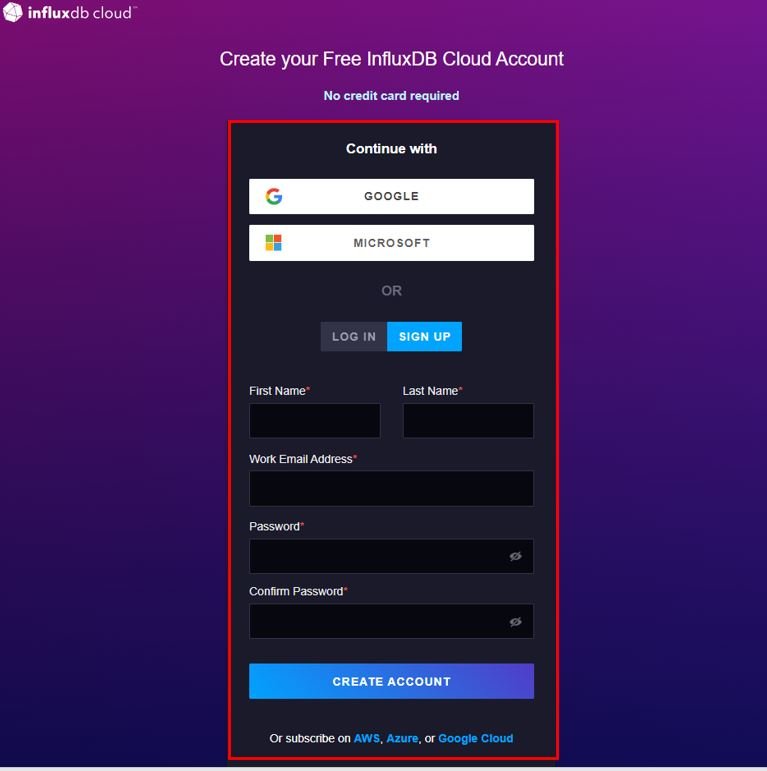
You will have to create a free InfluxDB cloud account. You can either continue with your Google or Microsoft account or login by providing your details as shown below to create an account.
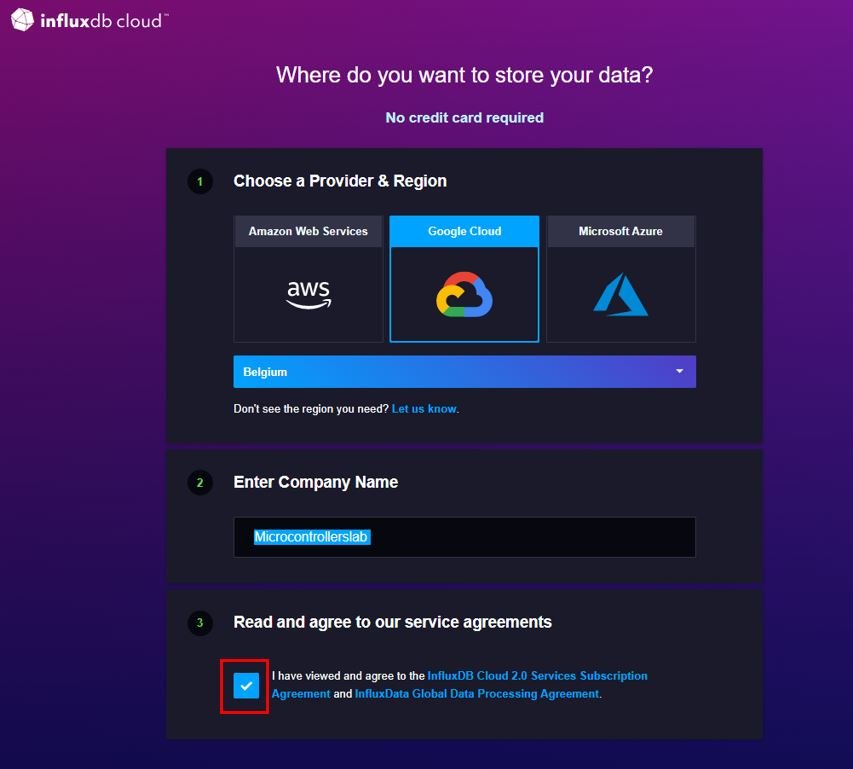
The next step is to choose where you would like to store the data. We are selecting Google Cloud as storage. You also have the option of using Amazon web services and Microsoft Azure. Moreover, the company name will also be required. Do not forget to tick the agreement after reading it.
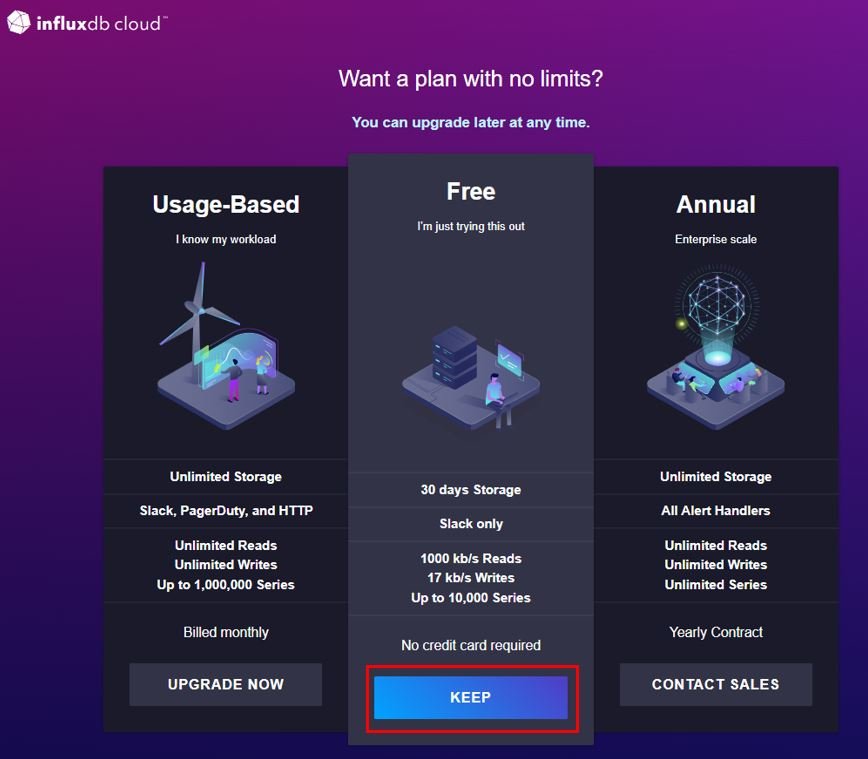
Next up we will be asked to select a plan. We will stick with the ‘Free’ plan as it works well with our projects.
Now the get started page will open up. By now we have successfully logged into InfluxDB, set our storage destination and chosen our InfluxDB cloud plan. Now we are ready to load data.
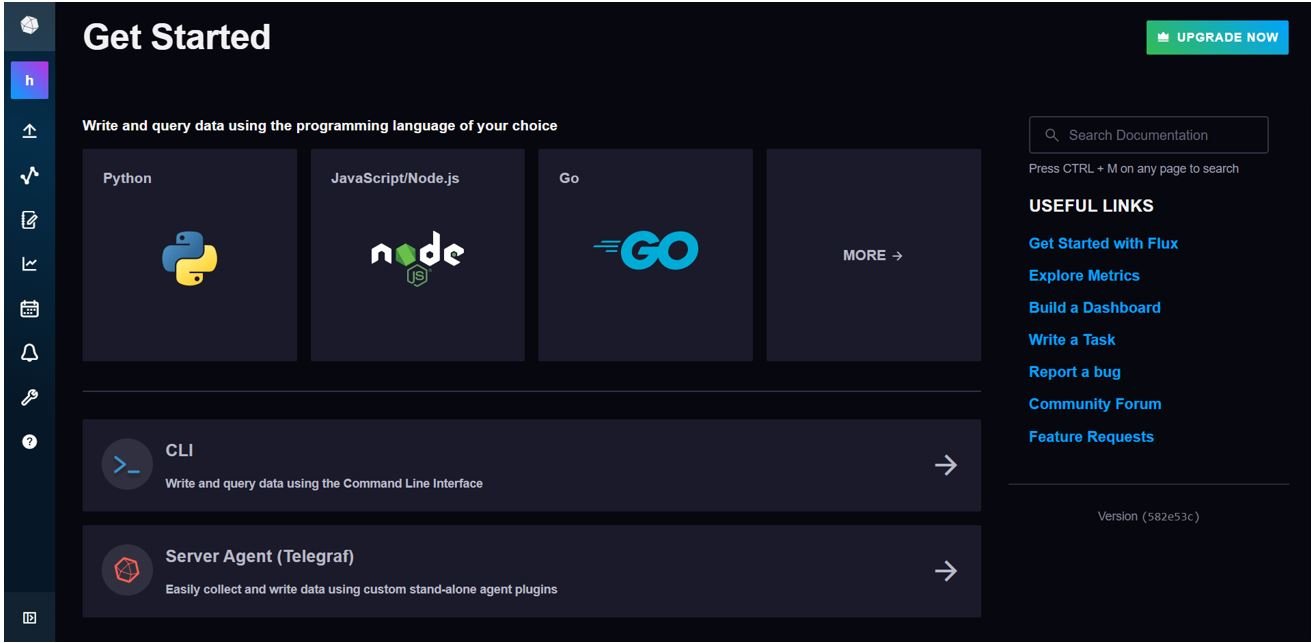
Load Data
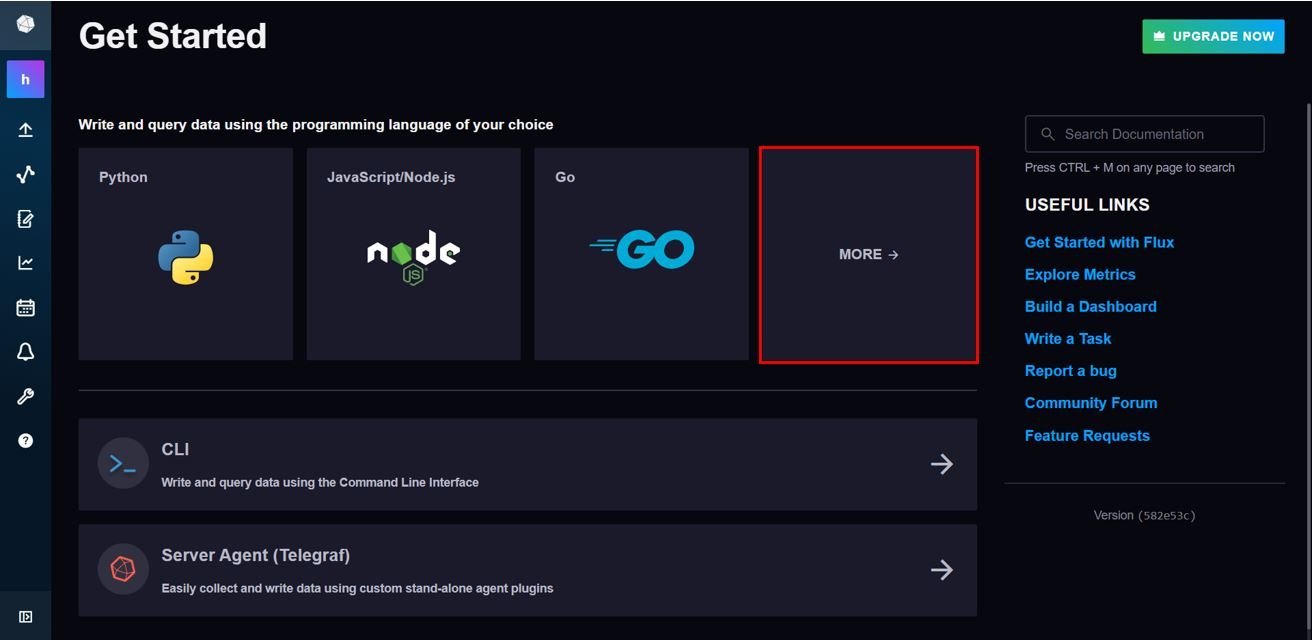
To load data to InfluxDB start by clicking the More button as highlighted below.
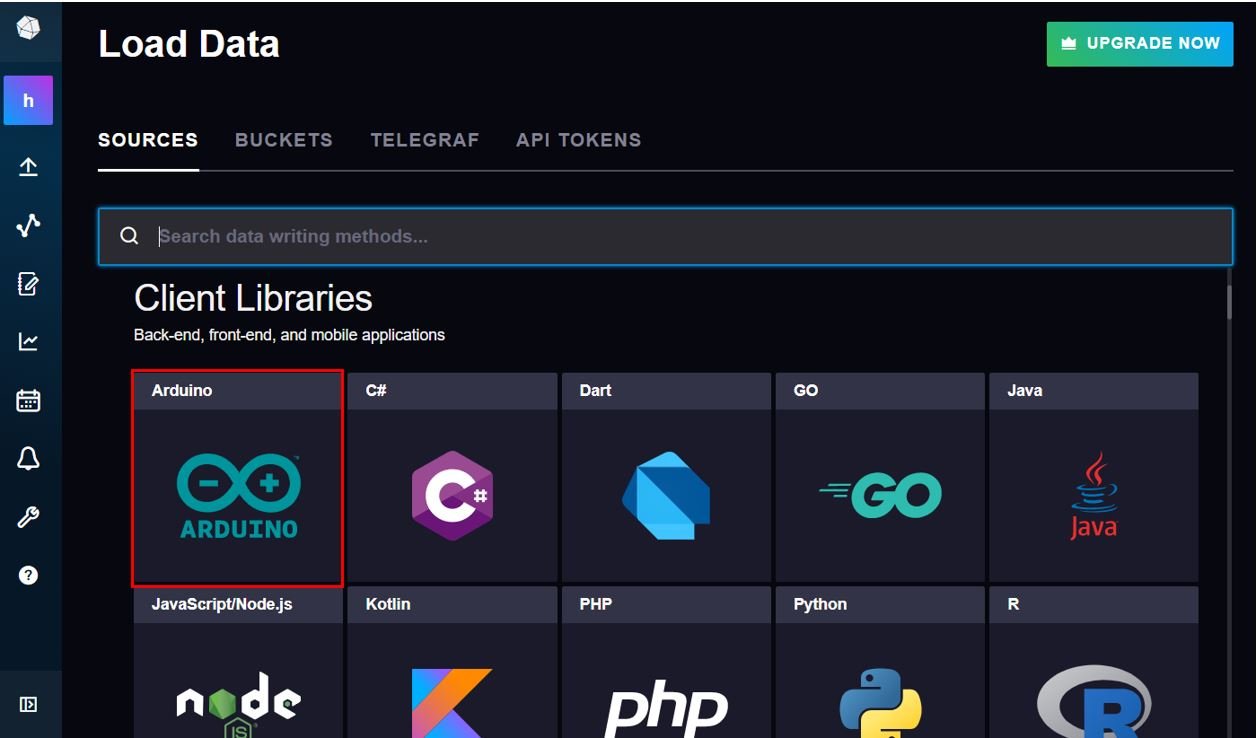
This will open the load data section. Here under the ‘Sources’ tab select Arduino as the client library.
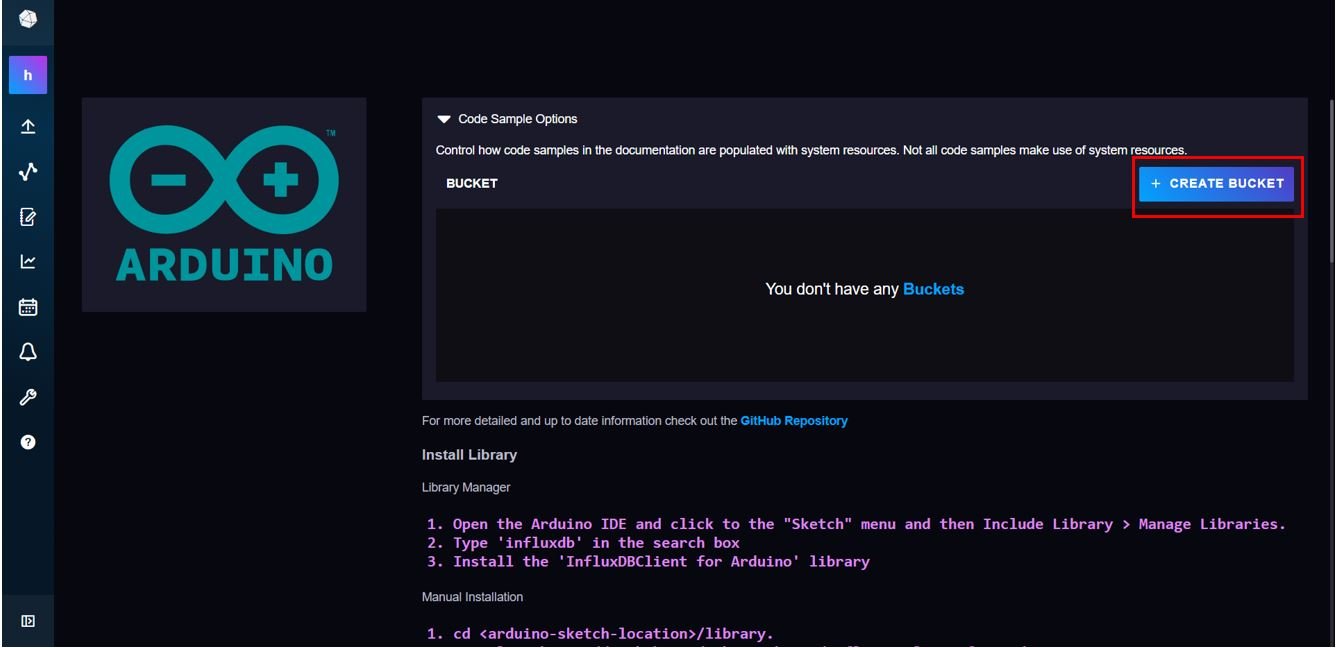
This will open up the bucket page with sample code as well. Currently we don’t have any bucket. First, we will have to create a bucket. Click ‘+ CREATE BUCKET’ to proceed forward.
Give a name to your bucket and customize the option to delete data according to your requirements. After that click ‘CREATE’ to complete the process of bucket creation.
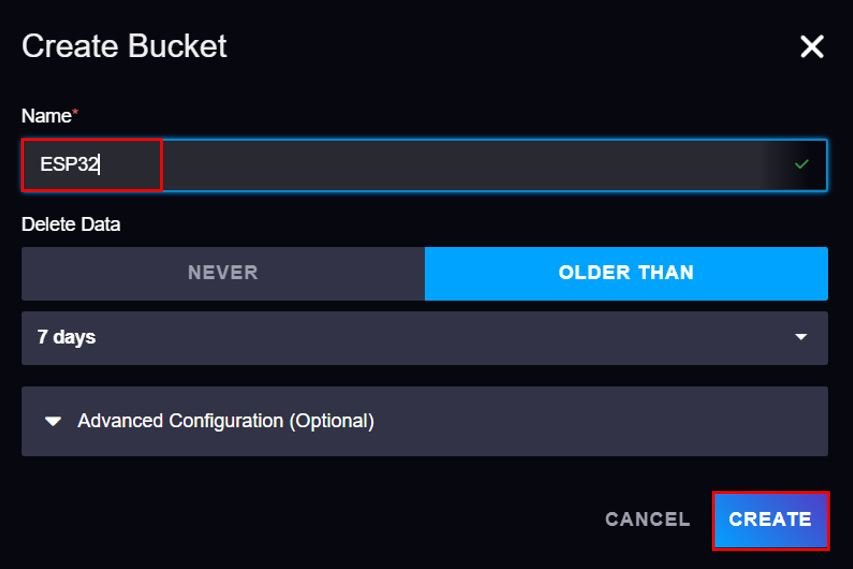
Now as you may see, in the bucket page we can view the bucket we just created. We had named it ‘ESP32’ and it can be found under the bucket section. Double click on it for the bucket to get selected.

Obtain InfluxDB Parameters (URL, ORG and Bucket)
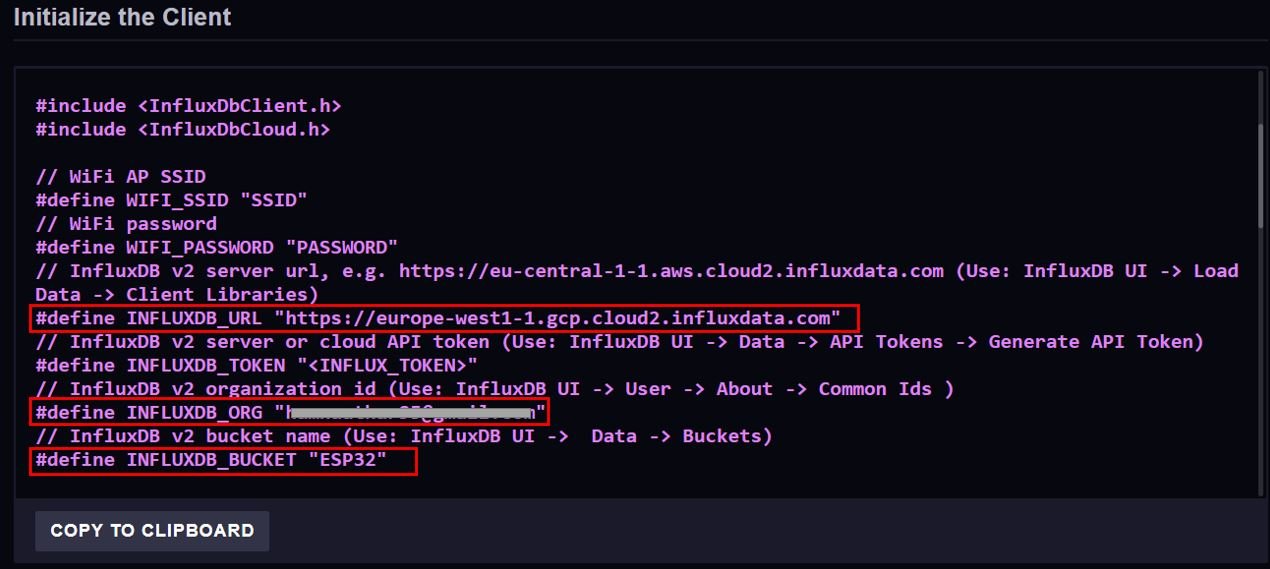
This is a very important step. We will obtain the InfluxDB URL, ORG and Bucket. These parameters will be used inside our program sketch to successfully send data to InfluxDB.
Inside our ESP32 bucket, head over to ‘Initialize the Client’ section. Here you can view the definitions of different InfluxDB parameters. Copy the INFLUXDB_URL, INFLUXDB_ORG and INFLUXDB_BUCKET.
Obtain API Token
The next important step is to generate an API Token. This is also required for securely reading/writing to the InfluxDB database.
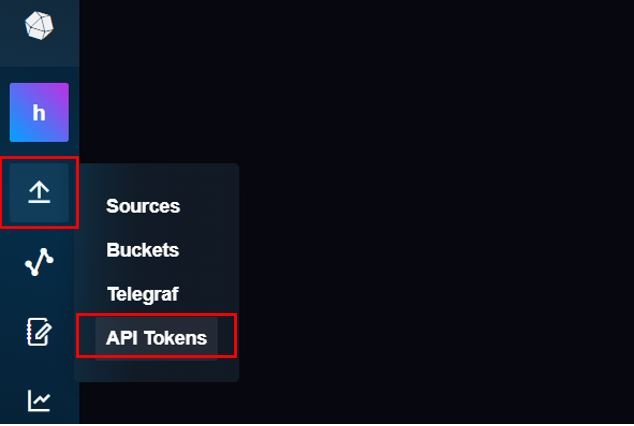
At the far left side, click the arrow icon as shown below and then select API Tokens.
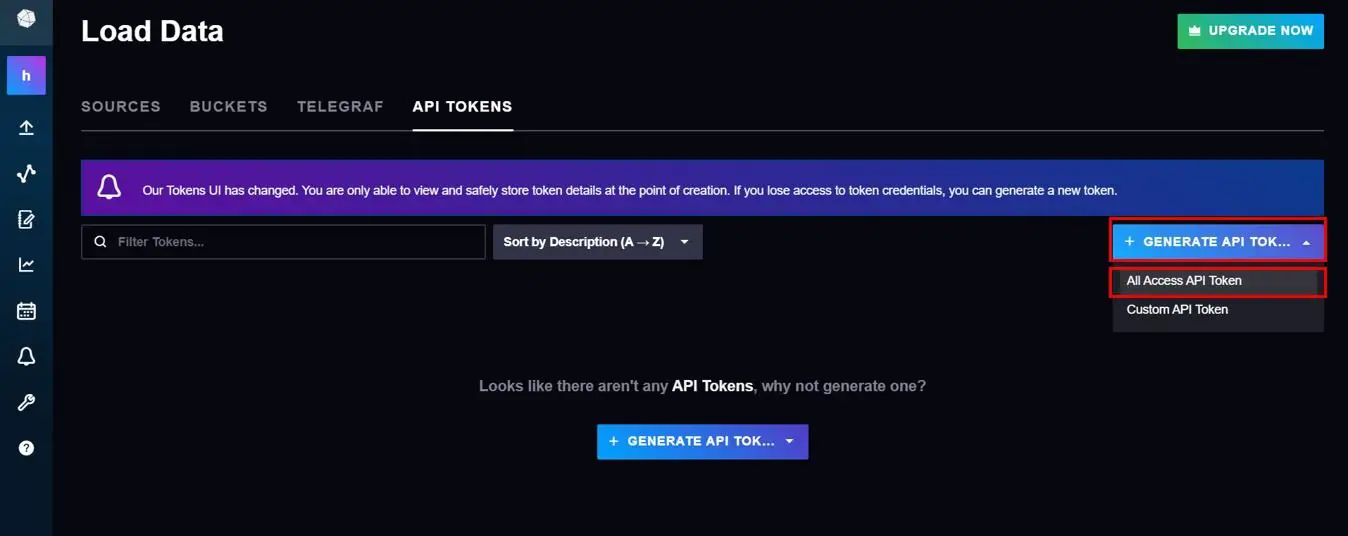
Now click + GENERATE API TOKEN and then click All Access API Token as highlighted below:
Give a description to your All Access API Token and save it.
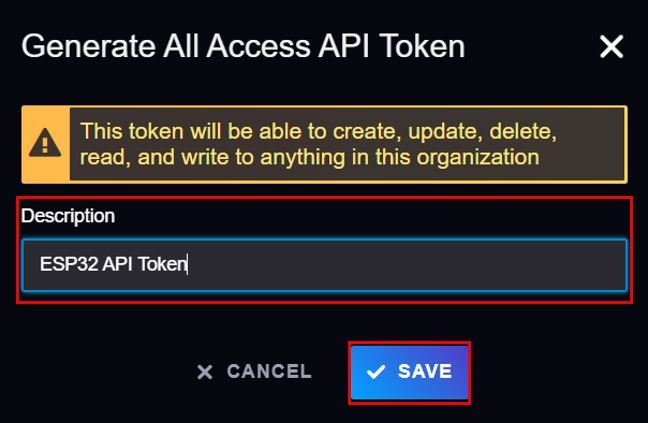
Now your API token will get generated. Copy it and save it securely. You will not be able to view it again.

ESP32/ESP8266 Record DHT11/DHT22 readings to InfluxDB
Now we are all set to send ESP32/ESP8266 data points in InfluxDB. For demonstration purposes, we will interface our ESP32 board with a DHT22 sensor and send current temperature and humidity readings to our ESP32 bucket in InfluxDB. The same procedure is applicable for ESP8266 board as well.
The DHT11/DHT22 is a sensor which measures relative humidity and temperature. It provides a calibrated digital output with a 1-wire protocol. Both sensors are inexpensive. They are quite similar to each other with some differences in specifications.
DHT22 is almost similar to the DHT11 but the former measures temperature and humidity with higher accuracy and supports a wider range. DHT22 offers a wider temperature range and resolution for temperature and humidity. But it is more expensive than DHT11. However, DHT11 has a better sampling period. Furthermore, the operating voltage range for both sensors is almost similar and we can directly power these sensors from power pins of ESP32 and ESP8266.
Regardless of the differences, both DHT sensors have the same working principle and same pinout. We can use the same Arduino sketch to read temperature and humidity readings by selecting the DHT type inside the code.
DHT sensors are pre-calibrated. We can directly connect them with ESP32/ESP8266 to obtain sensor output reading. They are internally composed of a humidity sensing sensor and a thermistor. These two components measure humidity and temperature.
DHT11/DHT22 Pinout
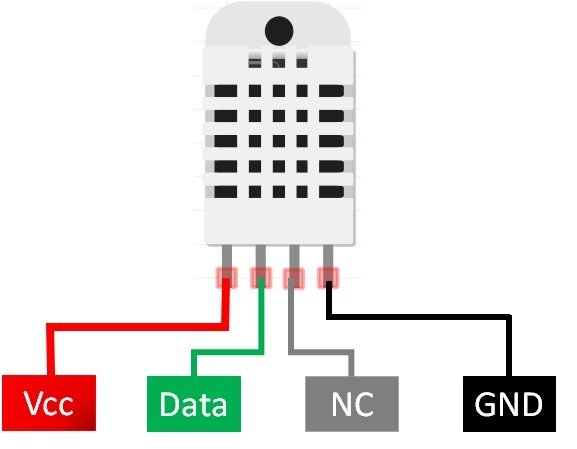
This following figure shows the pinout diagram of DHT sensors. DHT sensor consists of four pins. But on DHT modules only three pins are exposed to the pinout of the module and10k ohm pull-up resistor is internally connected to pin 2.
Pin Description
The following lists the pinout of the DHT sensor and their brief description. Pin number starts from left to right when you hold the sensor from the front end.
| DHT11/DHT22 Pin | ESP32/ESP8266 |
|---|---|
| 1 (Vcc) | 3.3V |
| 2 (Data Out) | Any GPIO pins of ESP boards along with a 10k ohm pull-up resistor |
| 3 (NC) | Not used |
| 4 (GND) | Ground |
- Vcc is the power supply pin. Apply voltage in a range of 3.3 V to 5.0 V to this pin
- Data Out is the digital output pin. It sends out the value of measured temperature and humidity in the form of serial data
- N/C is not connected
- GND: Connect the GND pin
Interfacing DHT11/DHT22 sensor with ESP32 and ESP8266
We will now learn how to connect this sensor with ESP32/ESP8266 board. We will need the following components.
Required Components
- ESP32/ESP8266 board
- DHT11/DHT22
- Bread Board
- 10K ohm resistor
- Jumper wires
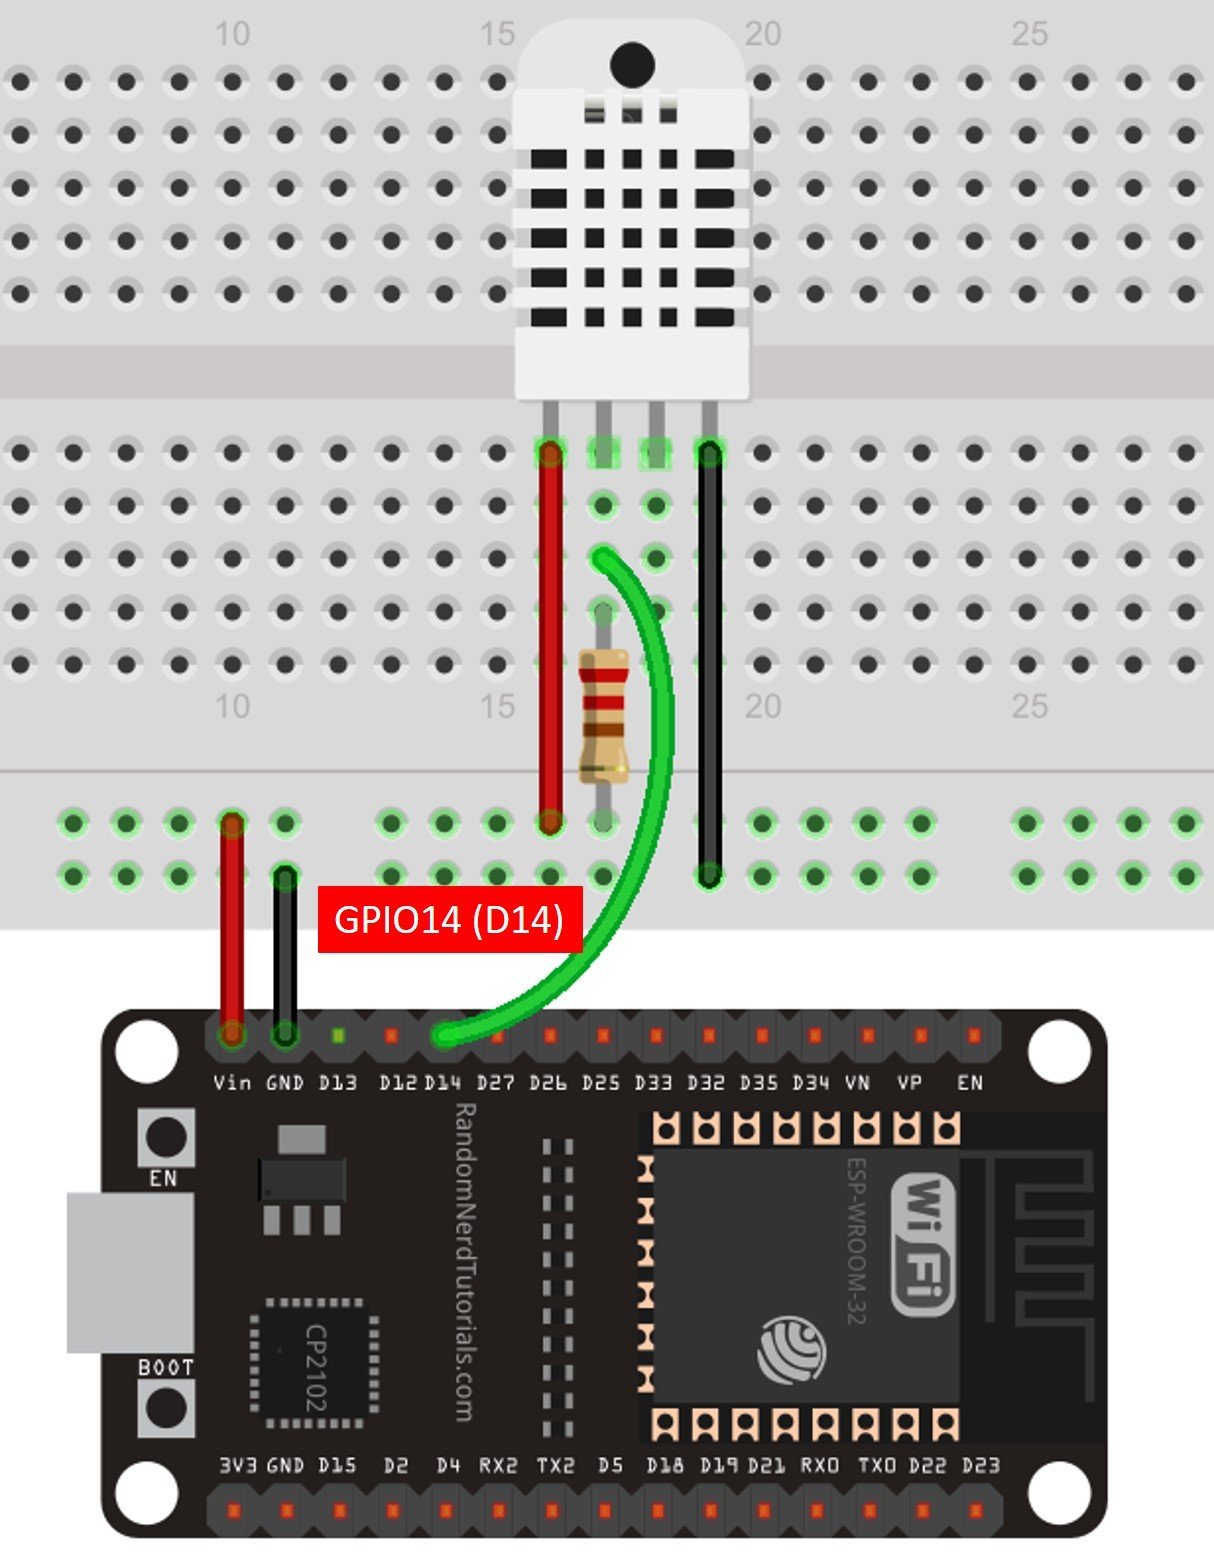
The first pin for both sensors (DHT11/DHT22) is a power supply(VCC) pin. Connect it with the 3.3 volt pin of ESP32/ESP8266.
Data out is the pin through which we get temperature and humidity samples from the DHT sensor. Connect this pin with GPIO14 of ESP32/ESP8266 and also connect the data pin with a 10k pull-up resistor. But you can also use any digital pin of ESP32/ESP8266.
A Pull-up resistor is used to keep the data pin high for proper communication between the microcontroller and sensor. You can check the datasheet of DHT11 and DHT22 to get more information about it. DHT22 is also known by the name of AM2302.
- Third pin is not used
- Connect the fourth pin (GND) to the ground pin of the ESP32/ESP8266 board
ESP32 Schematic Diagram
If you are using ESP32 for this project, connect ESP32 device with DHT22 as shown in the schematic diagram below:
ESP8266 Schematic Diagram
If you are using ESP8266 NodeMCU for this project, connect ESP8266 device with DHT22 as shown in the schematic diagram below:

Setting up Arduino IDE for ESP32/ESP8266 DHT11/DHT22 sensor data recording to InfluxDB
We will use Arduino IDE to program our ESP32/ESP8266 boards. Thus, you should have the latest version of Arduino IDE. Additionally, you also need to install the ESP32 and ESP8266 plugins respectively.
If your IDE does not have the plugins installed you can visit the links below:
- Installing ESP32 library in Arduino IDE and upload code.
- Installing ESP8266 library in Arduino IDE and upload code
Install InfluxDB Library in Arduino IDE
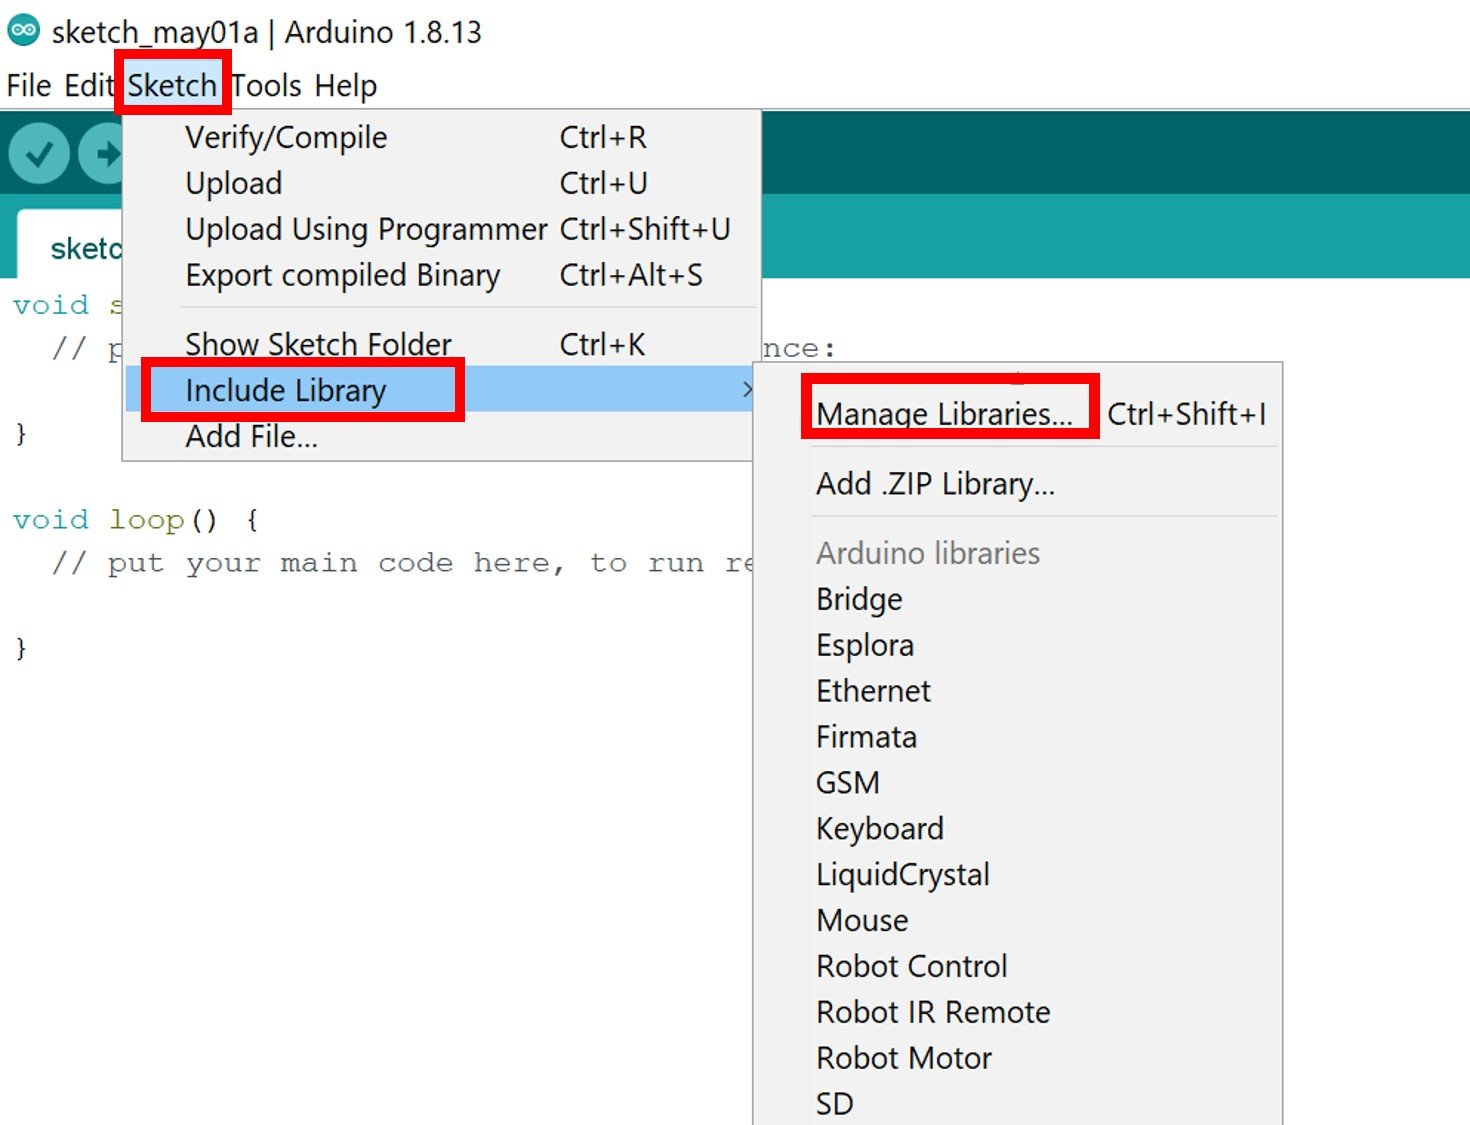
Open Arduino IDE and click on Sketch > Library > Manage Libraries
The following window will open up.
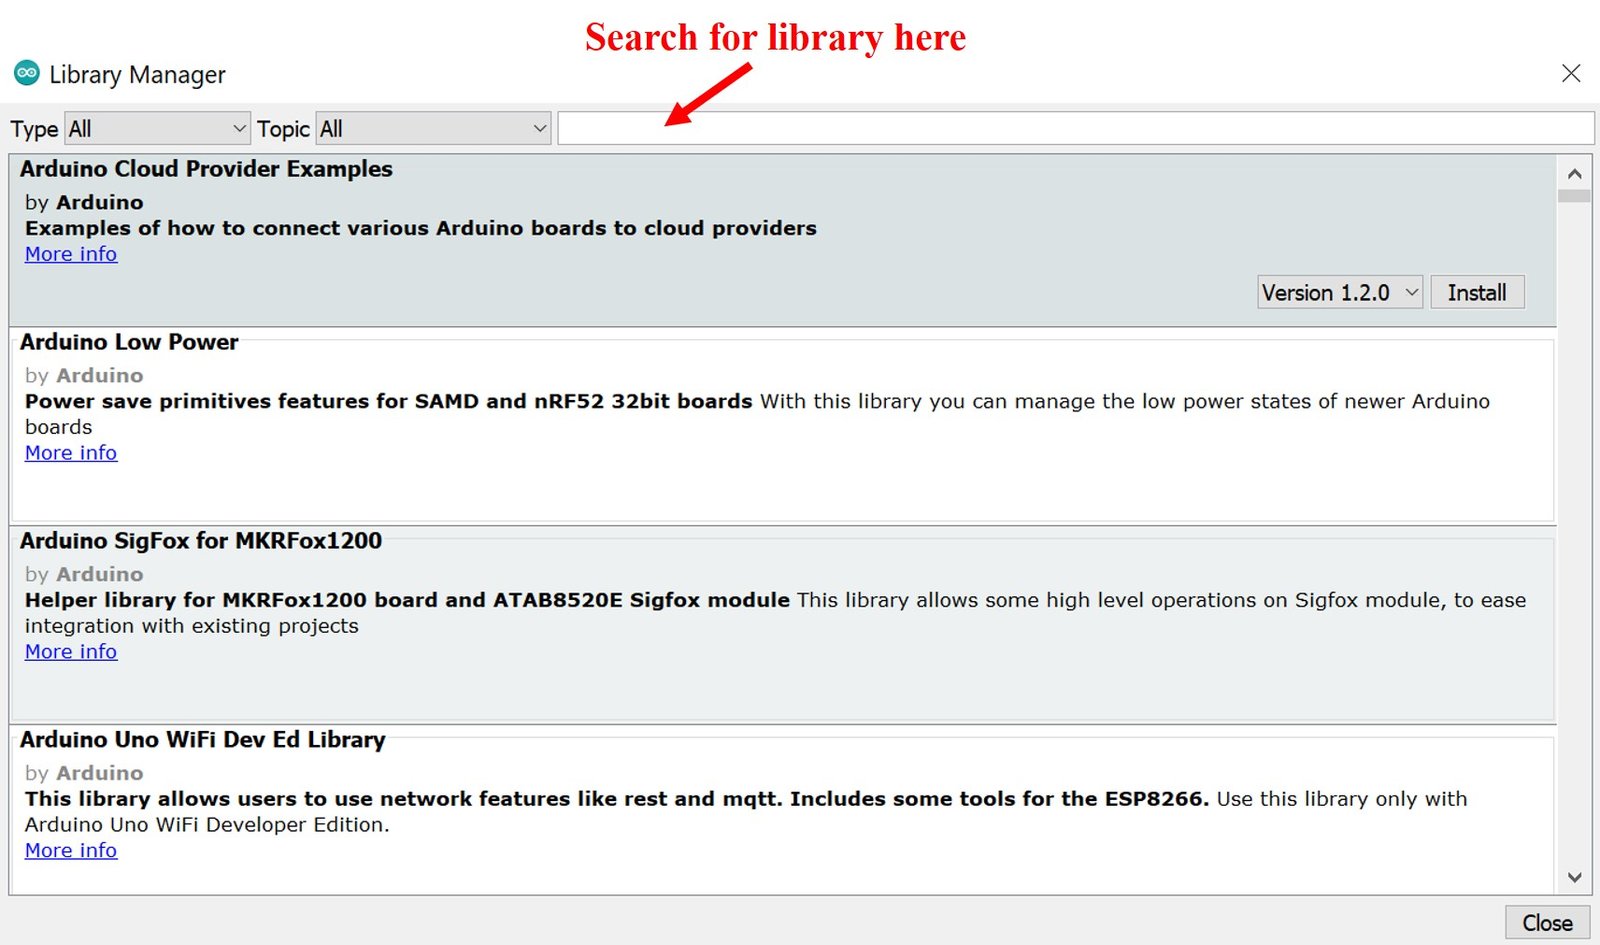
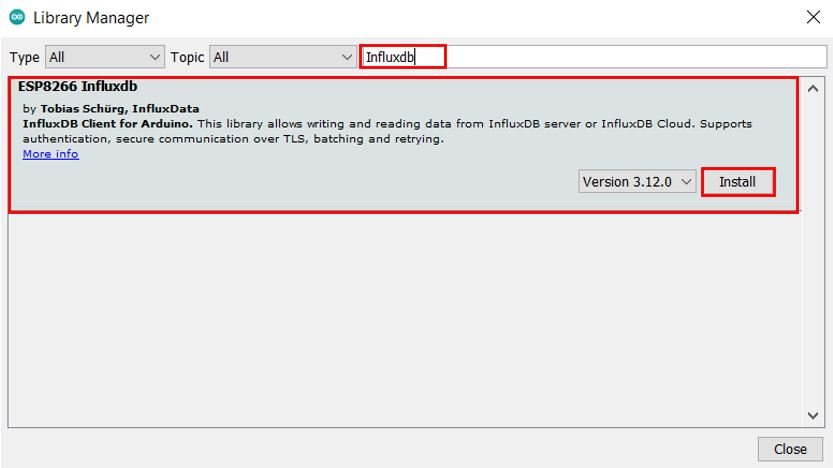
Type ‘Influxdb’ in the search bar and press enter. Install the latest version of the library as shown below. This library is compatible with both ESP8266 and ESP32 development boards.
Installing DHT11/DHT22 Library in Arduino IDE
Both DHT11 and DHT22 provide the output of temperature and humidity in the complex digital output format which can not be directly read with GPIO pins without writing any technique which can read these output signals. These sensors provide data through a single wire two-way communication protocol. A single process communication consists of 40 bits. But we do not need to worry about the working of these sensors and on which protocol we can receive this data. We have an Arduino library for DHT sensors which can be easily used to get values of temperature and humidity only by calling two lines of functions. We will see later on how to do it. Now let’s see how to install the DHT library in Arduino. This library is provided by Adafruit. Follow these steps to install the DHT sensor library:
Open Arduino IDE and click on Sketch > Library > Manage Libraries.
When you click on the manage libraries option, you will get this window. In this window write ‘DHT sensor‘ in the search bar and press enter.
You will see many options available for DHT11 and DHT22 libraries. Select Adafruit library and click on the install button. You can select the latest version from the version window.
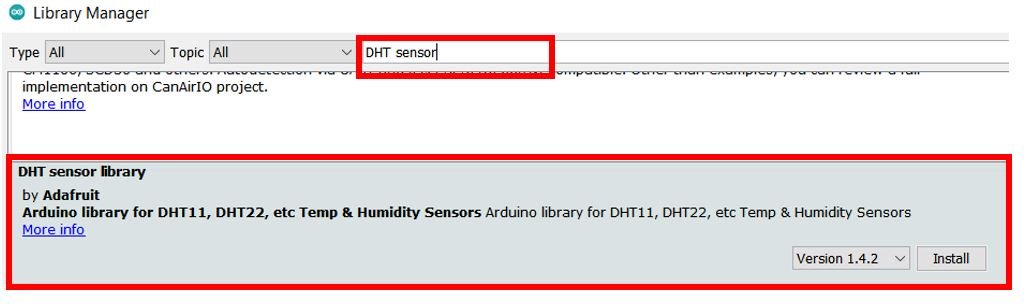
The same library can be used for both DHT11 and DHT22/AM2302 sensors.
Adafruit also provides libraries for other sensors. So they provided a support package which is used to handle all sensor libraries. We also need to install the Adafruit Unified Sensor library. To install this, paste the Adafruit Unified Sensor search bar and select this option and click on the install button.
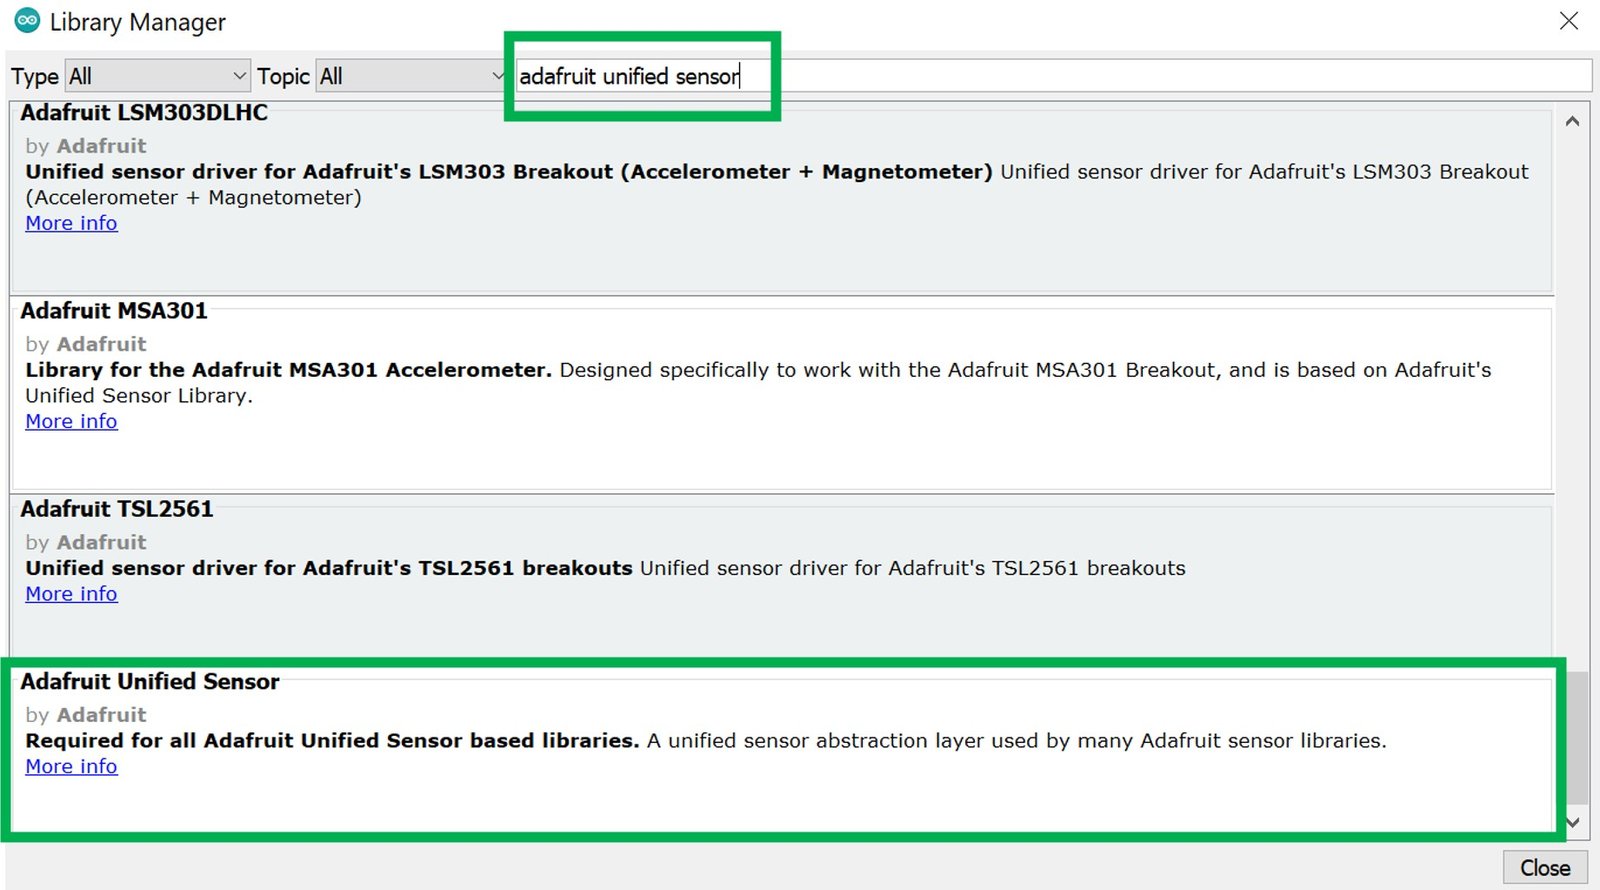
After installation of the libraries, restart your IDE.
You may also like to read:
- DHT11 DHT22 with ESP8266 NodeMCU – Display Readings on OLED
- DHT11 DHT22 with ESP32 – Display Readings on OLED
Sketch: ESP32/ESP8266 Record DHT11/DHT22 Sensor Data to InfluxDB
Open your Arduino IDE and go to File > New to open a new file. Copy the code given below in that file. Remember to change the Wi-Fi credentials, InfluxDB URL, ORG, Bucket name and the API token. Additionally, set the time zone string according to your location to synch time correctly.
This sketch is compatible with both ESP32 and ESP8266 development boards. It creates a data point on the database with tags and fields. After every 10 seconds, it saves the sensor readings taken from DHT11/DHT22 connected with your ESP development board.
#include <Wire.h>
#include "DHT.h"
#include <InfluxDbClient.h>
#include <InfluxDbCloud.h>

#if defined(ESP32)
  #include <WiFiMulti.h>
  WiFiMulti wifiMulti;
  #define DEVICE "ESP32"
#elif defined(ESP8266)
  #include <ESP8266WiFiMulti.h>
  ESP8266WiFiMulti wifiMulti;
  #define DEVICE "ESP8266"
#endif

// Uncomment one of the lines below for whatever DHT sensor type you're using!
//#define DHTTYPE DHT11 // DHT 11
//#define DHTTYPE DHT21 // DHT 21 (AM2301)
#define DHTTYPE DHT22 // DHT 22 (AM2302), AM2321

uint8_t DHTPin = 14;
DHT dht(DHTPin, DHTTYPE);

float temperature_Celsius;
float humidity;

#define WIFI_SSID "PTCL-08"
#define WIFI_PASSWORD "44332211"
#define INFLUXDB_URL "https://europe-west1-1.gcp.cloud2.influxdata.com"
#define INFLUXDB_TOKEN "r7UgtNaHKUXt75gDODrC9oXCKhG7eNuQSANkItAvfCebhrTPUvVeJn4RxWsre_CCrgEfmt29hcu09InpzUB09A=="
#define INFLUXDB_ORG "hamnaathar95@gmail.com"
#define INFLUXDB_BUCKET "ESP32"

// Set timezone string according to https://www.gnu.org/software/libc/manual/html_node/TZ-Variable.html
#define TZ_INFO "PKT-5"

// InfluxDB client instance with preconfigured InfluxCloud certificate
InfluxDBClient client(INFLUXDB_URL, INFLUXDB_ORG, INFLUXDB_BUCKET, INFLUXDB_TOKEN, InfluxDbCloud2CACert);

// Data points
Point sensor("measurements");

void setup() {
  Serial.begin(115200);
  pinMode(DHTPin, INPUT);
  dht.begin();
  WiFi.mode(WIFI_STA);
  wifiMulti.addAP(WIFI_SSID, WIFI_PASSWORD);
  Serial.print("Connecting to wifi");
  while (wifiMulti.run() != WL_CONNECTED) {
    Serial.print(".");
    delay(500);
  }
  Serial.println();

  // Add tags
  sensor.addTag("device", DEVICE);
  sensor.addTag("SSID", WiFi.SSID());

  timeSync(TZ_INFO, "pool.ntp.org", "time.nis.gov");

  if (client.validateConnection()) {
    Serial.print("Connected to InfluxDB: ");
    Serial.println(client.getServerUrl());
  } else {
    Serial.print("InfluxDB connection failed: ");
    Serial.println(client.getLastErrorMessage());
  }
}

void loop() {
  // Store measured values into points
  sensor.clearFields();

  humidity = dht.readHumidity();
  temperature_Celsius = dht.readTemperature();

  sensor.addField("Temperature",temperature_Celsius);
  sensor.addField("Humidity",humidity);

  Serial.print("Writing: ");
  Serial.println(client.pointToLineProtocol(sensor));

  // If no Wifi signal, try to reconnect it
  if (wifiMulti.run() != WL_CONNECTED) {
    Serial.println("Wifi connection lost");
  }
  // Write point
  if (!client.writePoint(sensor)) {
    Serial.print("InfluxDB write failed: ");
    Serial.println(client.getLastErrorMessage());
  }
  Serial.println("");
  Serial.println("Delay 10s");
  delay(10000);
}
How the Code Works?
The first step is to include all the necessary libraries for this project. WiFiMulti/ESP8266WiFiMulti library will allow us to add multiple Wi-Fi networks inside our sketch and the ESP32/ESP8266 connects with the strongest network. However, we will use a single network in this example. Secondly, also include the InfluxDB libraries that we just installed. This will ensure an easy and successful ESP32/ESP8266 communication with InfluxDB. Moreover, the other libraries included are for the DHT sensor’s functionality.
Also, create an object of WiFiMulti if using ESP32 and an object of ESP8266WiFiMulti if using ESP8266.
#include <Wire.h>
#include "DHT.h"
#include <InfluxDbClient.h>
#include <InfluxDbCloud.h>


#if defined(ESP32)
  #include <WiFiMulti.h>
  WiFiMulti wifiMulti;
  #define DEVICE "ESP32"
#elif defined(ESP8266)
  #include <ESP8266WiFiMulti.h>
  ESP8266WiFiMulti wifiMulti;
  #define DEVICE "ESP8266"
#endif
This is used to define which type of DHT sensor we want to use. You can use this with DHT11, DHT21, and DHT22 sensors. You should uncomment the line according to the sensor you are using. For example, we are using DHT22 in this tutorial, we have uncommented this, and others remain commented. DHTTYPE variable stores the name of the sensor we are using.
// Uncomment one of the lines below for whatever DHT sensor type you're using!
//#define DHTTYPE DHT11 // DHT 11
//#define DHTTYPE DHT21 // DHT 21 (AM2301)
#define DHTTYPE DHT22 // DHT 22 (AM2302), AM2321
We will define the name of the GPIO pin of ESP32/ESP8266 with which we will connect the DHT11/DHT22 sensor. We are using GPIO pin number 14.
Next we will create the object of DHT according to our defined pin number and DHT type. We have defined both these parameters in the last steps.
uint8_t DHTPin = 14;
DHT dht(DHTPin, DHTTYPE);
Create two float variables to hold the DHT22 temperature and humidity readings respectively.
float temperature_Celsius;
float humidity;
InfluxDB Parameters
The next step is very important. Carefully define your Wi-Fi SSID, Wi-Fi password, InfluxDB URL, InfluxDB ORG, InfluxDB API token and InfluxDB bucket name. The parameters related to InfluxDB are the ones that we previously acquired and saved.
#define WIFI_SSID "WRITE_YOUR_SSID"
#define WIFI_PASSWORD "WRITE_YOUR_PASSWORD"
#define INFLUXDB_URL "WRITE_YOUR_URL"
#define INFLUXDB_TOKEN "WRITE_YOUR_API_TOKEN"
#define INFLUXDB_ORG "WRITE_YOUR_ORG"
#define INFLUXDB_BUCKET "WRITE_YOUR_BUCKET"
Now, define the time zone according to your location. This is necessary to sync the time.
Refer to the link given below to obtain the time zone closest to your location and define it in code.
https://github.com/nayarsystems/posix_tz_db/blob/master/zones.csv
We have set the time zone for Asia/Karachi hence we use PKT-5.
// Set timezone string according to https://www.gnu.org/software/libc/manual/html_node/TZ-Variable.html
#define TZ_INFO "PKT-5"
The next step is to create an InfluxDBClient instance. This will generate a secure client with a preconfigured certificate.
InfluxDBClient client(INFLUXDB_URL, INFLUXDB_ORG, INFLUXDB_BUCKET, INFLUXDB_TOKEN, InfluxDbCloud2CACert);Here we will create a data point called ‘measurements’ in the InfluxDB database. This will consist of a measurement, tag set, field key, field value and timestamp. In this case the point instance is called sensor.
Point sensor("measurements");setup()
Inside the setup() function, we will open the serial communication at a baud rate of 115200. Then we will set the ESP32/ESP8266 in station mode.
Serial.begin(115200);
WiFi.mode(WIFI_STA);
Then add the Wi-Fi network for the ESP32/ESP8266 to connect with. This will be done using the addAP() method on the WiFiMulti object. Here we will specify two parameters. The first parameter is the SSID and the second parameter is the password. You can add as many networks as you want. We are only adding a single network.
wifiMulti.addAP(WIFI_SSID, WIFI_PASSWORD);We will use the run() method on the WiFimulti object, to connect ESP32/ESP8266 with the strongest Wi-Fi connection. This returns the status of the Wi-Fi connection.
The following lines of code will be used to monitor if the ESP32/ESP8266 is connected or not. While the connection is lost, it will try to connect again.
Serial.print("Connecting to wifi");
  while (wifiMulti.run() != WL_CONNECTED) {
    Serial.print(".");
    delay(500);
  }
  Serial.println();
The pinMode function will configure the DHTPin as a digital input pin. The dht.begin() function will initialize the DHT22 sensor and we can read temperature and humidity values from DHT11/DHT22 sensor.
  pinMode(DHTPin, INPUT);
  dht.begin();
Now add the tags to the data point. This is done using the addTag() method on the point instance. It takes in two parameters. The first is the tag key and the second is the tag value.
Here we are adding two tags to the data point. One for the device name and another for the Wi-Fi SSID.
  sensor.addTag("device", DEVICE);
  sensor.addTag("SSID", WiFi.SSID());
Next we will sync the time with the NTP server using the timeSync() function.
timeSync(TZ_INFO, "pool.ntp.org", "time.nis.gov");Lastly, the InfluxDB client confirms its connection to the server. A relevant message will be printed in the serial monitor in either case if the client is connected or not.
  if (client.validateConnection()) {
    Serial.print("Connected to InfluxDB: ");
    Serial.println(client.getServerUrl());
  } else {
    Serial.print("InfluxDB connection failed: ");
    Serial.println(client.getLastErrorMessage());
  }
loop()
Inside the loop() function, we store the data to the point. First of all we will clear all the fields of the point instance.
sensor.clearFields();The following lines get the values of temperature in Celsius and humidity from the DHT sensor and save them in humidity and temperature_Celsius variables.
  humidity = dht.readHumidity();
  temperature_Celsius = dht.readTemperature();
Next, we add the Temperature and Humidity fields to our measurements point. This is done by using the addField() method on the Point instance. We specify the key as the first parameter and the value as the second parameter.
  sensor.addField("Temperature",temperature_Celsius);
  sensor.addField("Humidity",humidity);
Then we will display on the serial monitor the information that is being written to the point. The data will be shown in the Line Protocol form.
  Serial.print("Writing: ");
  Serial.println(client.pointToLineProtocol(sensor));
Additionally, connect to the Wi-Fi network incase of disconnection.
  if (wifiMulti.run() != WL_CONNECTED) {
    Serial.println("Wifi connection lost");
  }
Lastly, write the point to the database after every 10 seconds. This is done by using client.writePoint() and passing the point as the parameter inside it.
  if (!client.writePoint(sensor)) {
    Serial.print("InfluxDB write failed: ");
    Serial.println(client.getLastErrorMessage());
  }
  Serial.println("");
  Serial.println("Delay 10s");
  delay(10000);
Demonstration
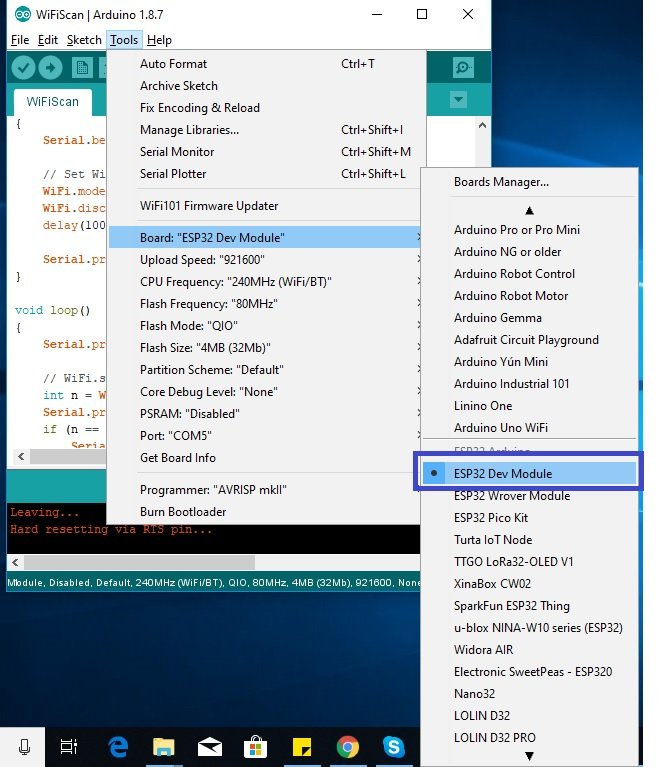
Choose the correct board and COM port before uploading your code to the board. Therefore go to Tools > Board and select ESP32 Dev Module or NodeMCU 1.0.
If you are using ESP32, select the ESP32 Dev module as follows:
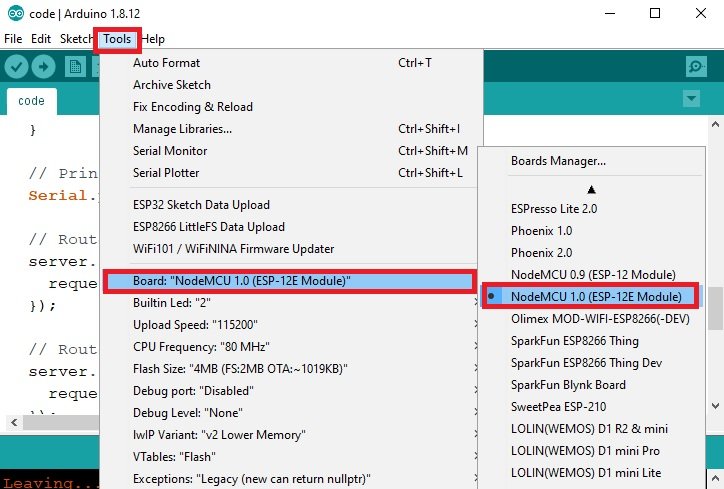
If you are using ESP8266 NodeMCU, select the NodMCU module as follows:
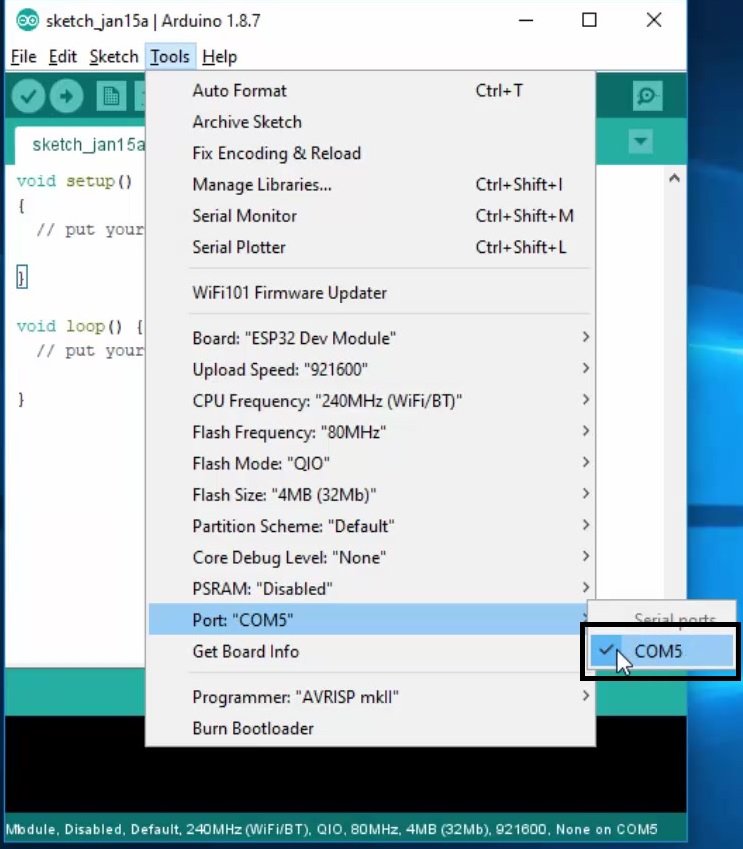
Then, go to Tools > Port and select the appropriate port through which your board is connected.
Click on the upload button to upload the code to ESP32 or ESP8266 development board.
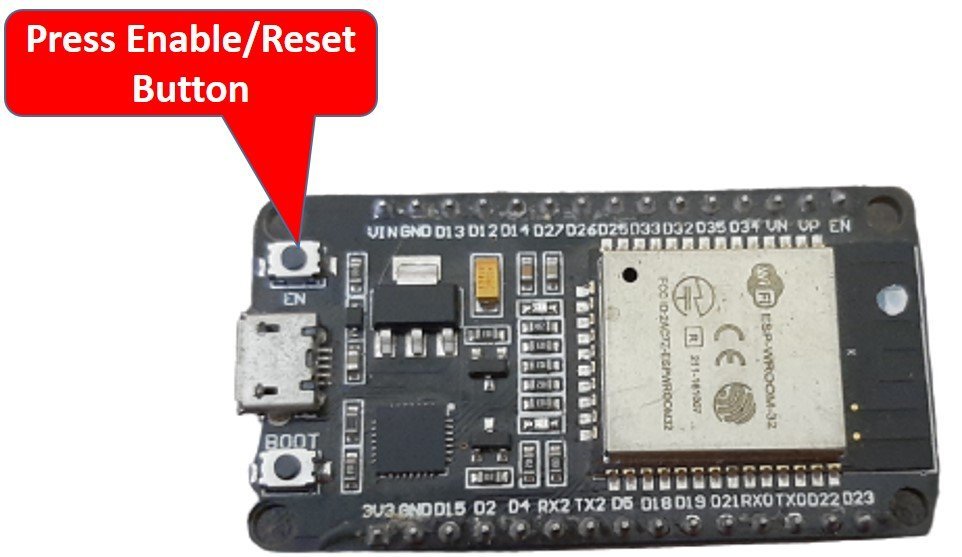
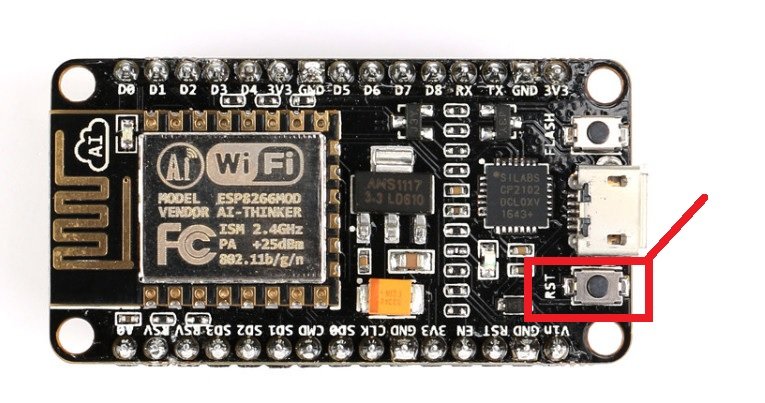
After you have uploaded your code to the ESP32 or ESP8266 development board, press its ENABLE/RST button.
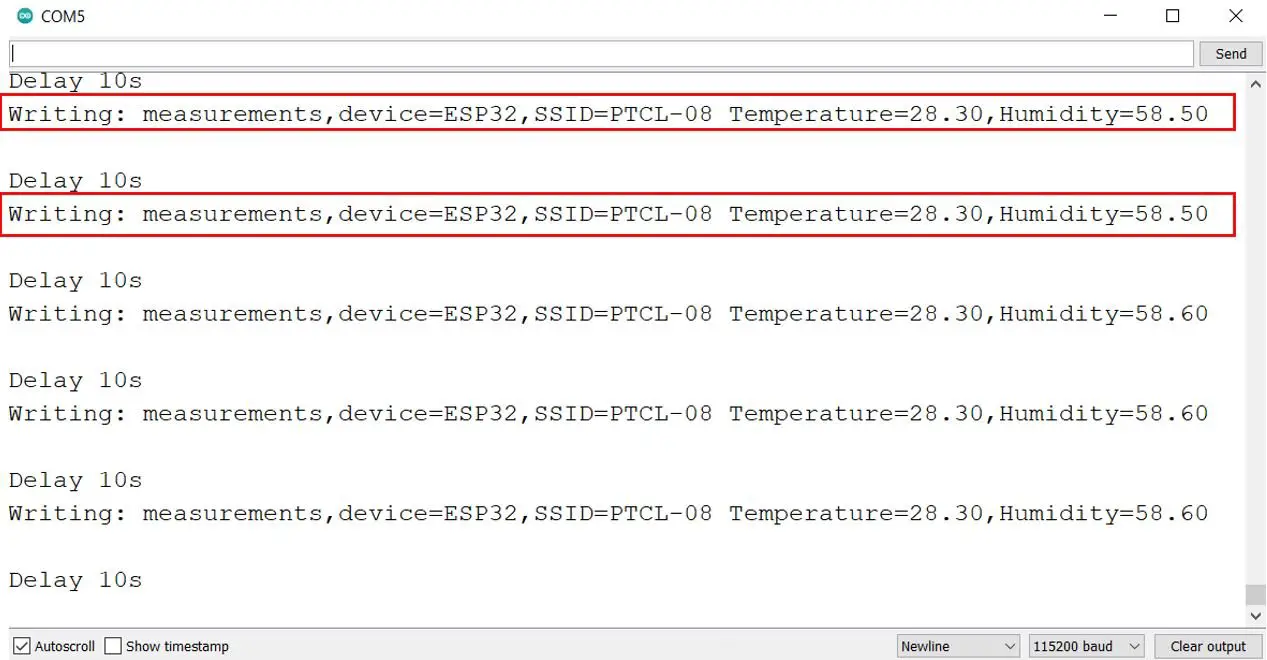
In your Arduino IDE, open up the serial monitor and set the baud rate to 115200. First the board will connect with the local Wi-Fi then the time will sync. Next the client gets connected to InfluxDB server and you can view the data being written to the database after every 10 seconds.
Visualize Data in InfluxDB
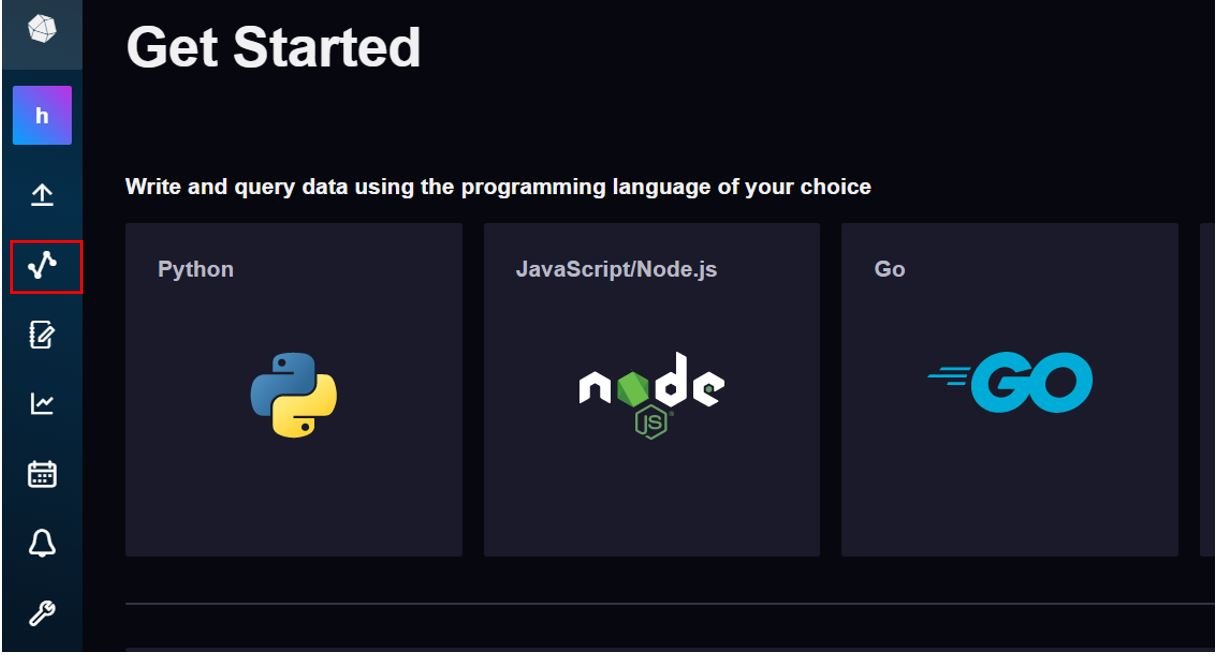
Now let us visualize the data that we sent to InfluxDB Cloud. Login to your InfluxDB account and head over to Data Explorer as shown below.
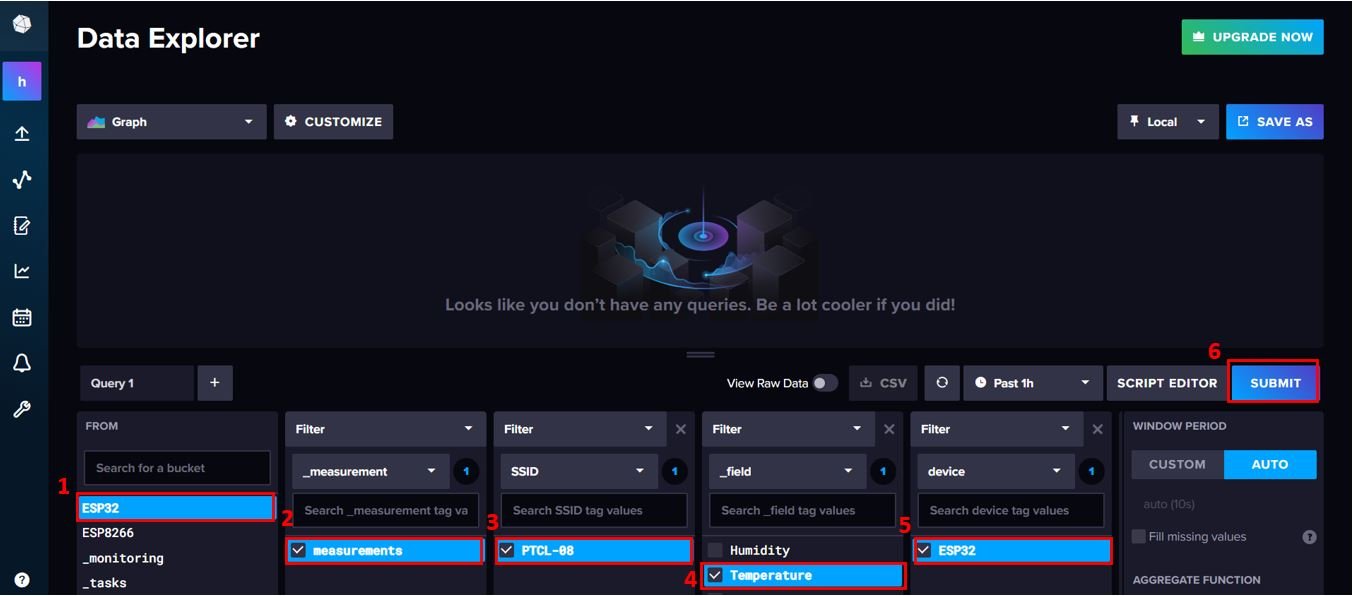
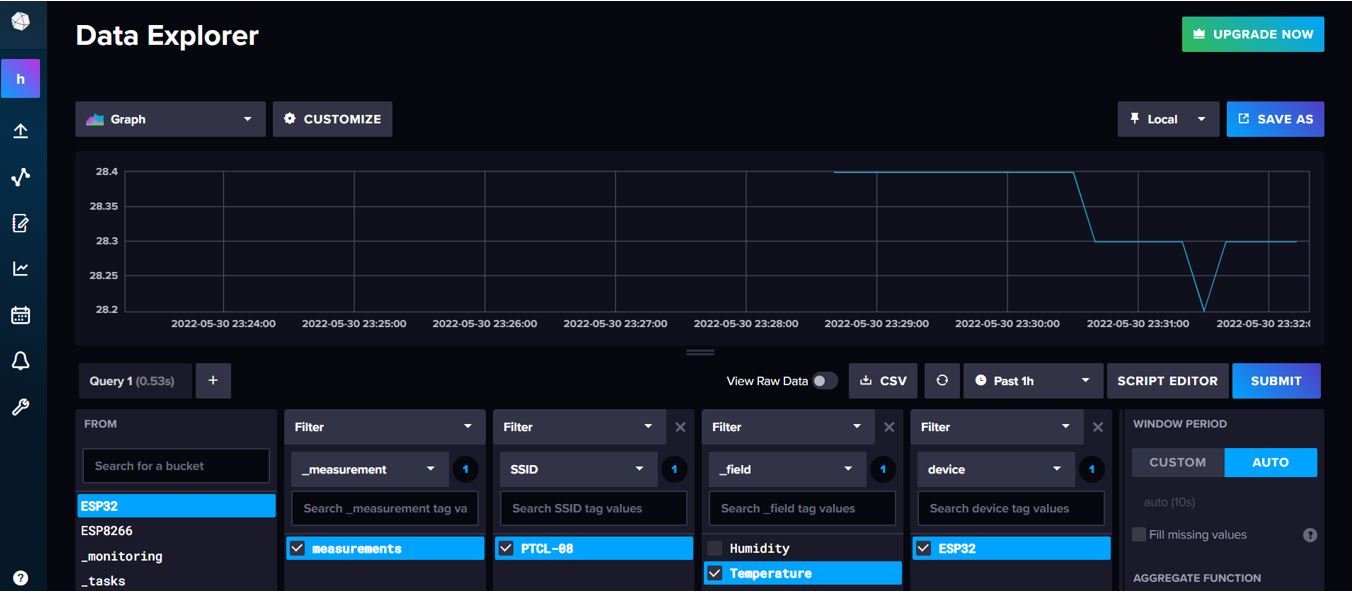
This will open the Data Explorer page. Here we will be able to graph the data that is being sent to the InfluxDB cloud. First click the bucket that you previously created. In our case it is called ‘ESP32.’ Then to view temperature readings click measurements under the measurement filter, the SSID being used under the SSID filter, Temperature which is the field tag under the field filter and the device under the device filter. Click Submit to display the data.
Now you can view the Temperature data being plotted in a graph. You can also customize it as well.
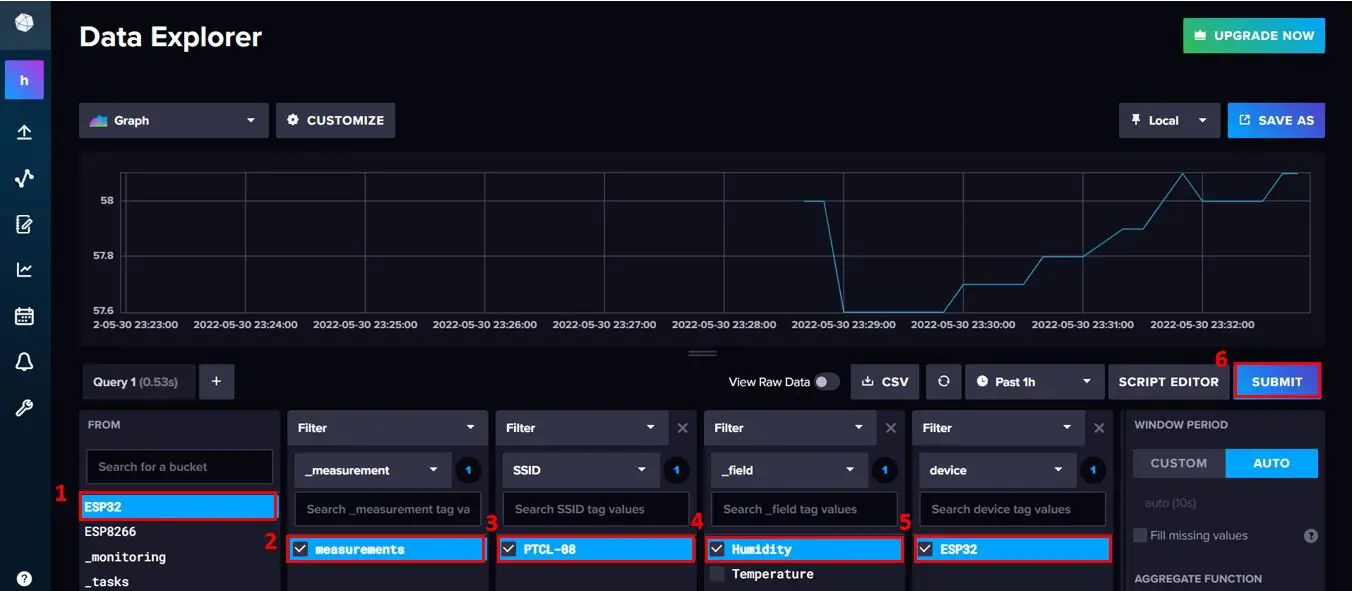
To view humidity readings click measurements under the measurement filter, the SSID being used under the SSID filter, Humidity which is the field tag under the field filter and the device under the device filter. Click Submit to display the data.
Now you can view the humidity data being plotted in a graph.
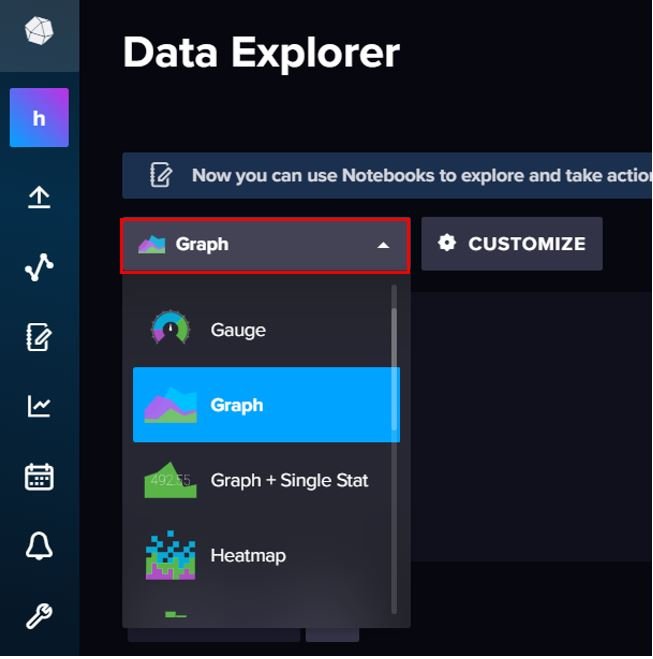
Moreover, you can also display the data in various formats including band, gauge, histogram, map etc. Just select it from the dropdown below.
Build InfluxDB DHT22 Dashboard
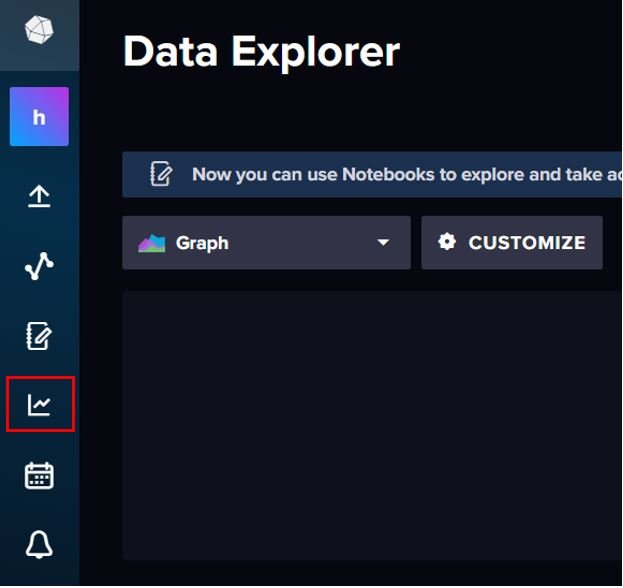
Now let us show you how to display the data in various formats on the same page. We will create a dashboard. Head over to the Dashboard icon and click it.
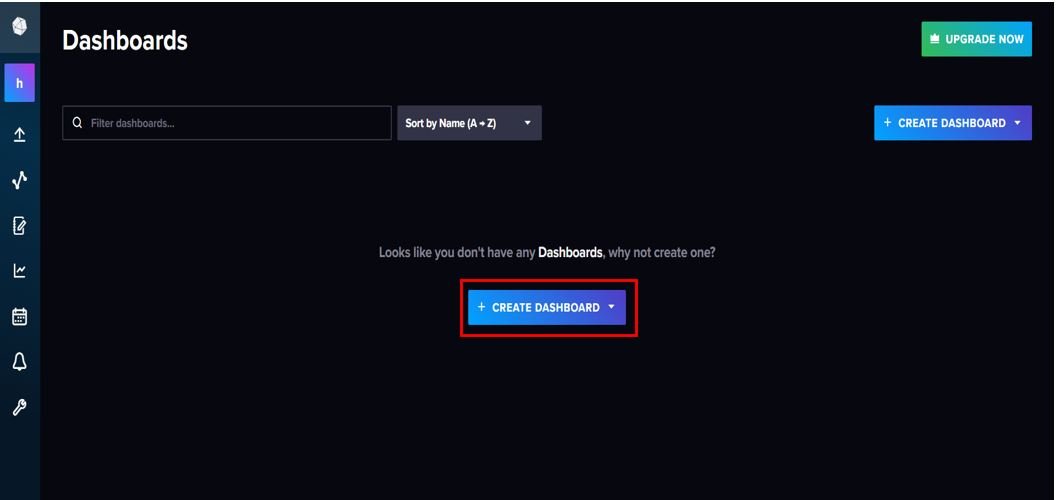
This will open the Dashboard open. Currently, we do not have any dashboard created. Click ‘+ CREATE DASHBOARD’ button as highlighted below:
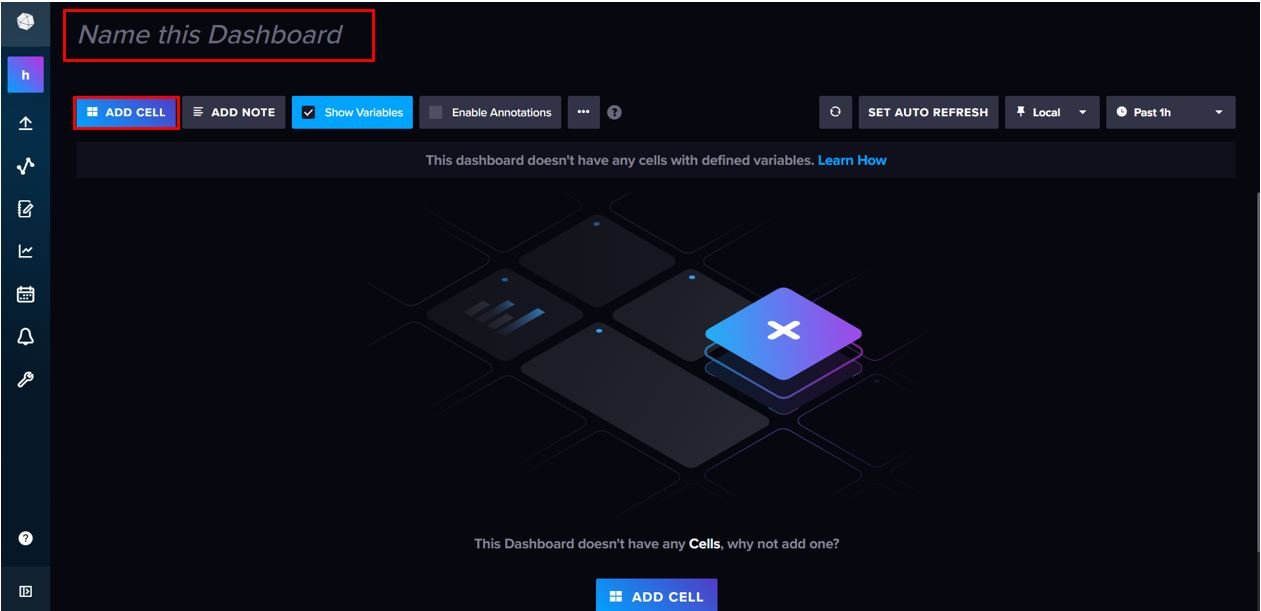
Give a name to your dashboard. Then click ADD CELL to add a visualization.
Temperature
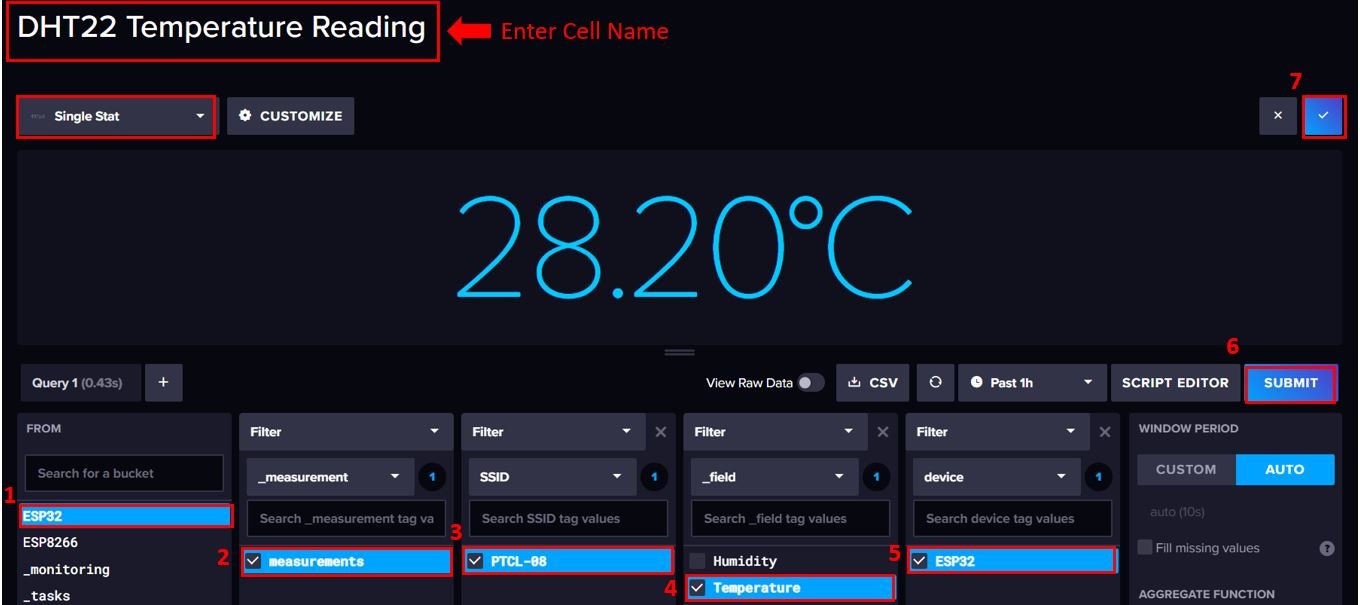
Specify the name of the cell. We have given it the name ‘DHT22 Temperature Reading.’ Next choose the visualization from the dropdown menu. We have selected Single Stat.
To obtain the data make a query like we did previously in the data explorer. First click the bucket name, then tick measurements under the measurement filter, the SSID being used under the SSID filter, Temperature which is the field tag under the field filter and the device name under the device filter. Click the submit button for the changes to take place. You will be able to view the visualization. As we are displaying the temperature reading as a single stat hence we got the reading 28.20. You can also customize the visualization from the CUSTOMIZE button. Here we have customized the visualization by adding °C unit as a suffix. After you are satisfied, then click the tick button for the cell to be added to the dashboard.
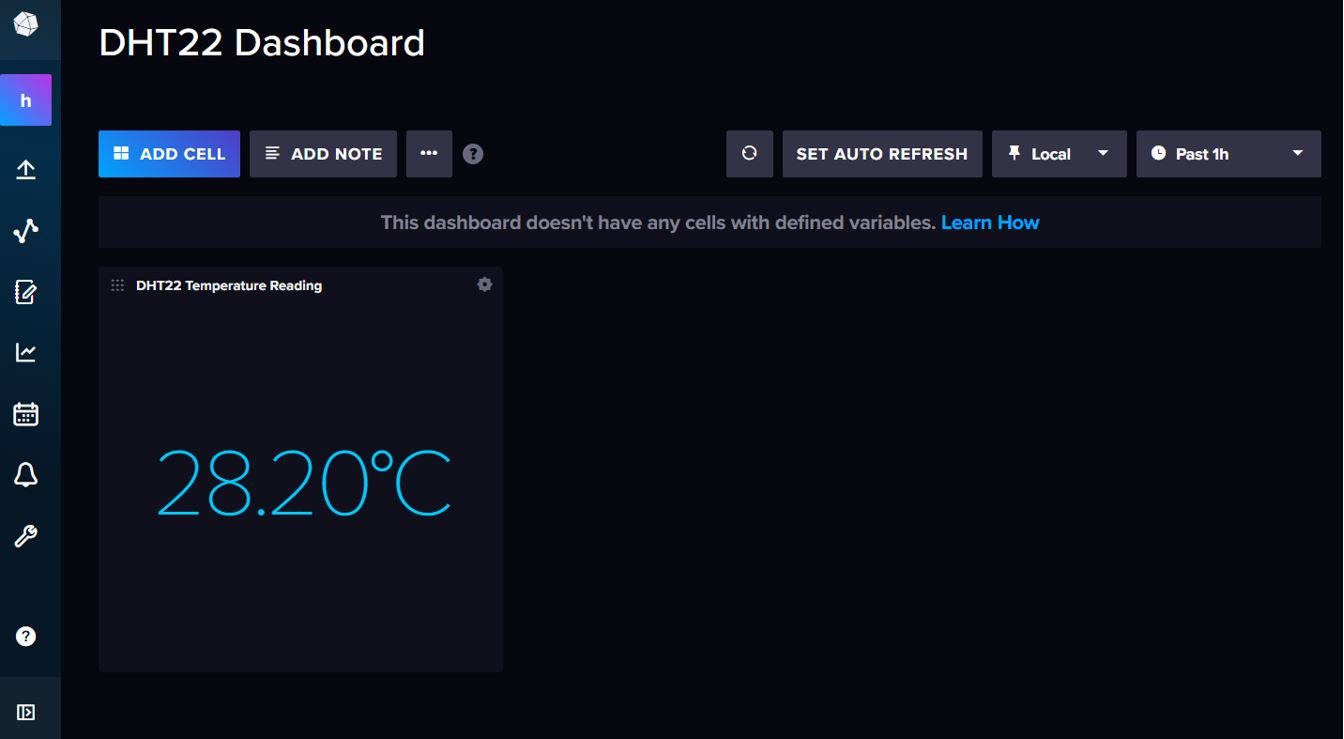
As you may see, the reading can now be seen in our dashboard.
To add more visualizations click ‘ADD CELL’ again and follow the procedure as described previously.
Humidity
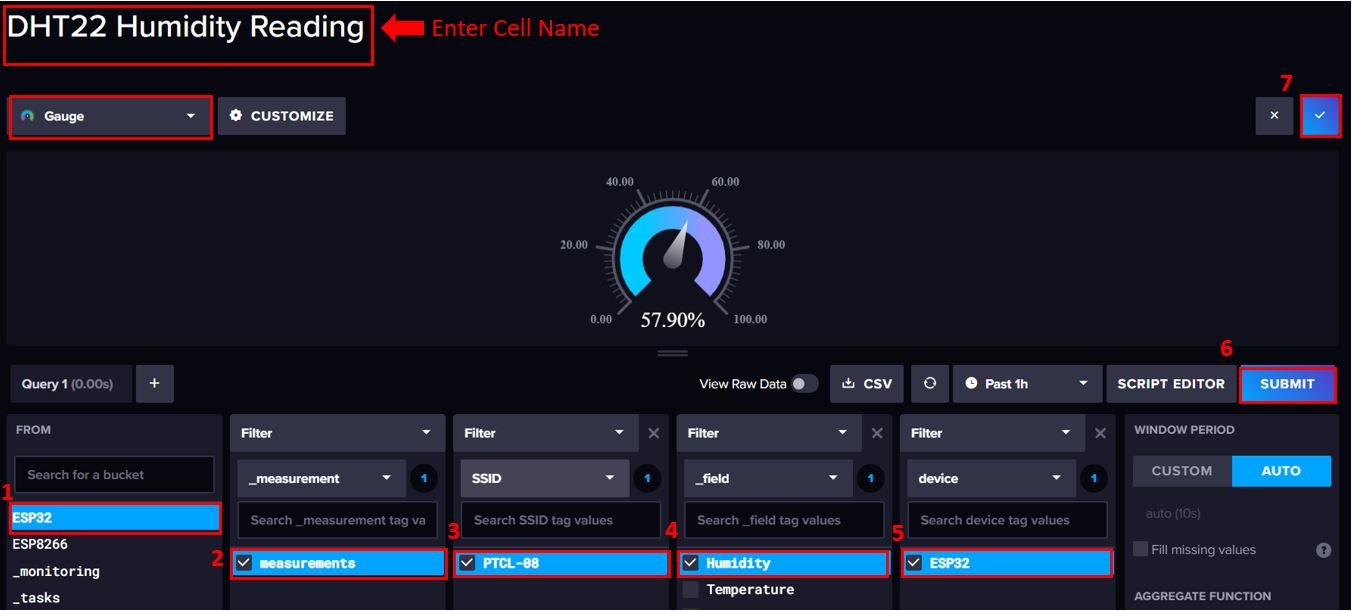
Next to add the visualization for humidity readings, we will create another cell. Give it a name. Next choose the visualization from the dropdown menu. We have selected Gauge for this.
To obtain the data make a query like we did previously in the data explorer. First click the bucket name, then tick measurements under the measurement filter, the SSID being used under the SSID filter, Humidity which is the field tag under the field filter and the device under the device filter. Click the submit button for the changes to take place. You will be able to view the visualization. Here we have customized the visualization by adding % unit as a suffix. Then click the tick button for the cell to be added to the dashboard.
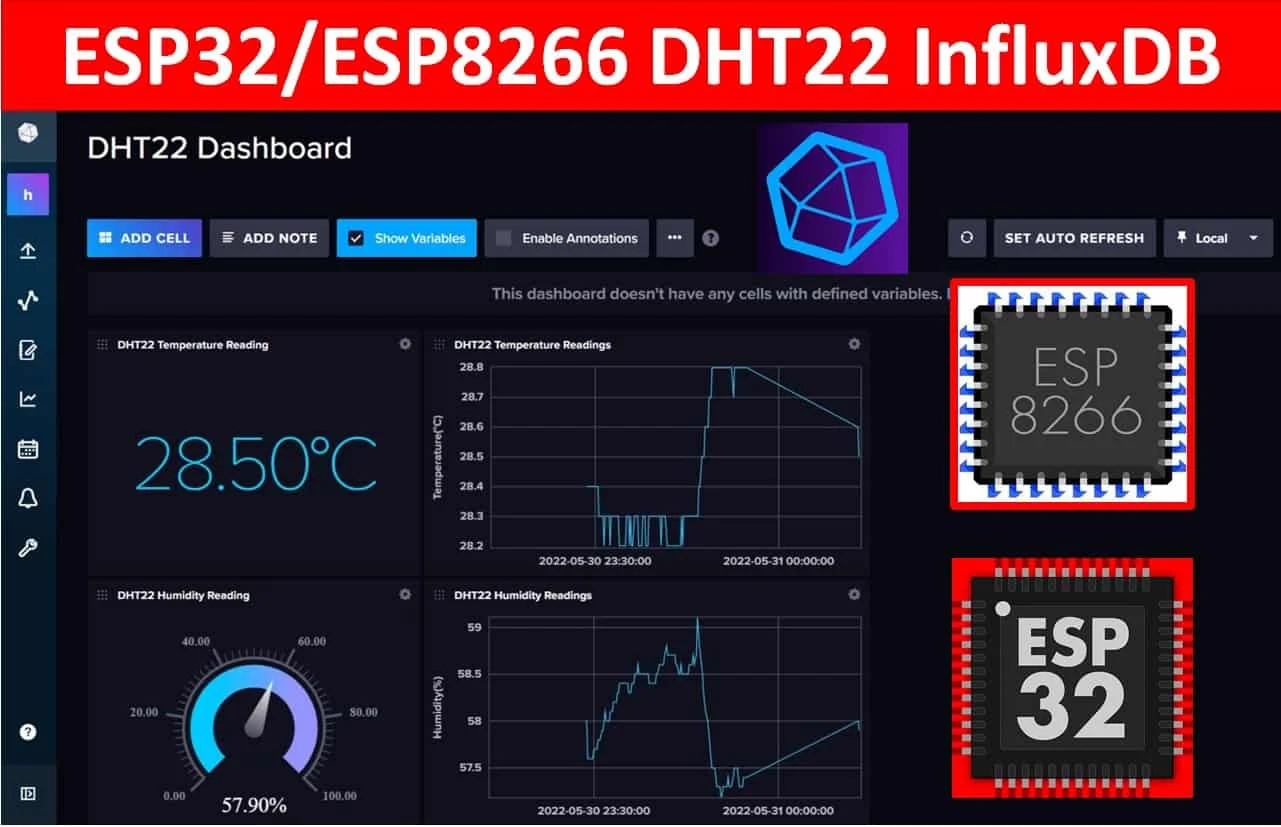
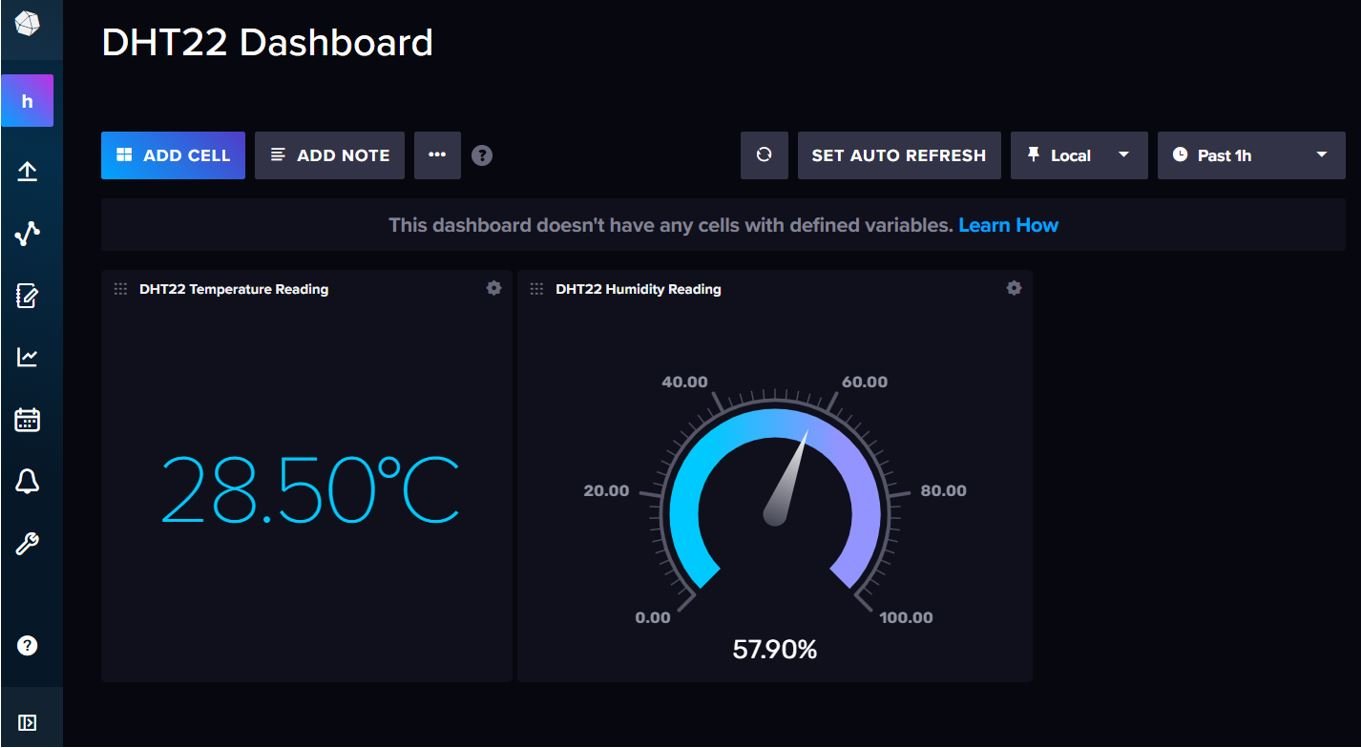
This is how our DHT22 dashboard looks like with the two cells added. You can also change the settings to set the time to refresh your dashboard.
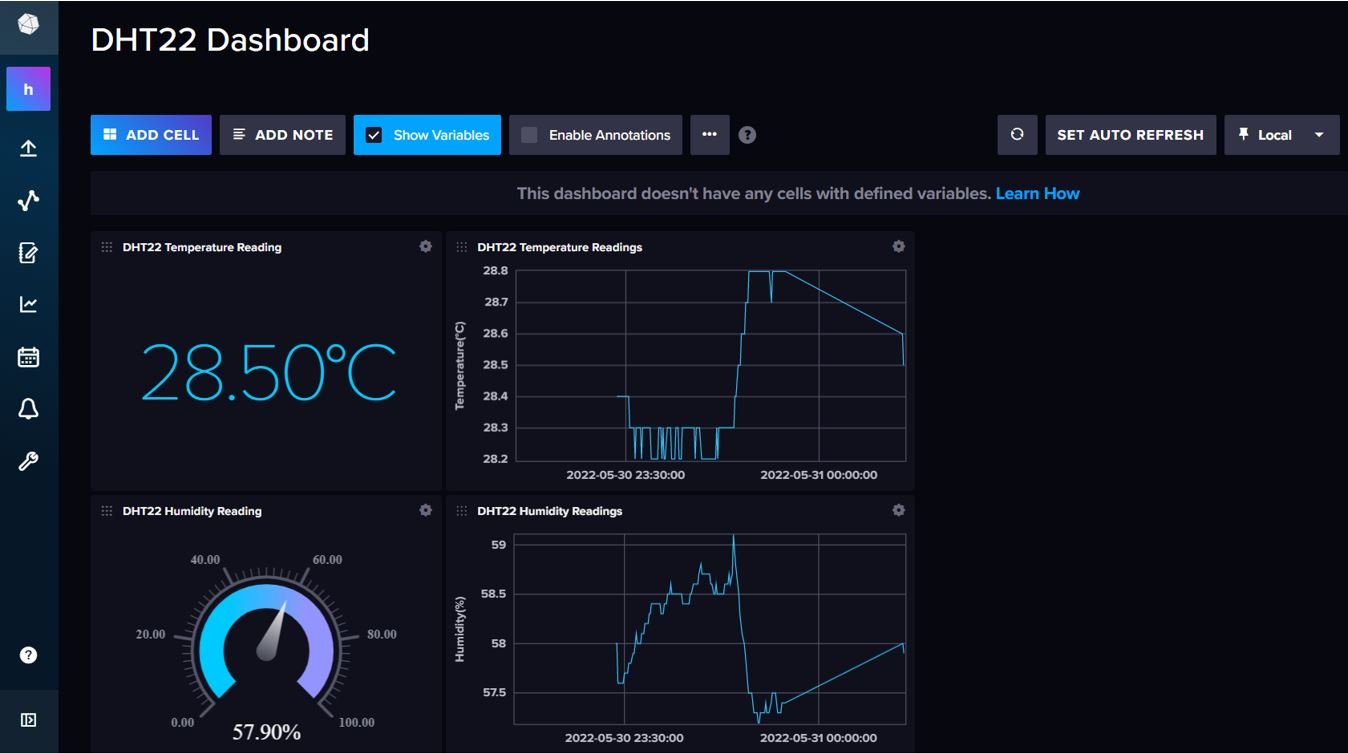
We have also added the graphs for both the temperature and humidity readings as well to see the changes in the readings.
You may also like to check:
Cant get this working,
Writing: measurements,device=ESP8266,SSID=home
InfluxDB write failed:
and in /var/log/syslog
influxdb influxd-systemd-start.sh[458]: ts=2023-01-23T07:38:09.461094Z lvl=error msg=”Unable to write gathered points” log_id=0fZLQ2Ll000 service=scraper scraper-name=”new target” error=”database not found: 3455babcbb219623″
I have checked bucket name, api token all correct, any ideas?
Thanks