In this tutorial, we will learn how to interface TCS230 or TCS3200 color sensor with Arduino. First, we will go through the color sensor basics and their working principles then we will move towards the Arduino sketches. We will show you how to interface this sensor with your Arduino board easily and then set up a calibration sketch to find the different RGB values associated with three basic colors (red, green, and blue). Lastly, using our calibrated values we will work up another sketch where we will be able to identify the color of an object by placing the sensor in front of it.
Recommended Components
The following components are used in this project or are helpful for building it with the Arduino.
| Component | How it’s used in this project | Buy on Amazon |
|---|---|---|
| Arduino Uno R3 | The main microcontroller board that runs the sketch and reads the sensors/modules in this project. | Check Price |
| Breadboard | Lets you wire the components to the Arduino without soldering for quick prototyping. | Check Price |
| Jumper Wires | Connect the Arduino pins to the module and other parts on the breadboard. | Check Price |
As an Amazon Associate we earn from qualifying purchases. Prices and availability are accurate as of the date/time indicated and are subject to change.
Introducting TCS230/TCS3200 Color Sensor
A color sensor is a type of sensor which has a property to analyze different types of colors such as green, blue or red, etc. The TCS230/TCS3200 sensor uses a light source for analyzing the color. This means that at first, it emits the light through the LED’s source and then absorbs this light which comes back after the collision of any specific object or thing. On the basis of this reflected light, the Arduino connected with the sensor analyses the color of that specific object. There are many color sensors available in the market but we will focus on TCS230/TCS3200 color sensor because it is easily interfaced with any microcontroller or Arduino board. It is used in different applications such as in quality control systems, environmental systems and packing control systems, etc. This type of sensor is easily available in the market or online shops.
The figure below shows the two variants of the TCS230/TCS3200 color sensors available in the market:

Note: The module reacts to infrared so it needs to be used in an enclosed room or used with an infrared filter to block its effect.
Pinout
Let us look at the pinout of TCS3200 or TCS230 color sensing module first. The following diagram shows its pinout in detail.

TCS230 Color Sensing Module consists of 8 pins including S0, S1, S2, S3, Output Enable pin, Ground pin, VCC, and output pin. The following table shows the pin numbers with their configuration.
| Pin Number | Configuration |
|---|---|
| 1 & 2 | S0 & S1 |
| 3 | OE |
| 4 | GND |
| 5 | VCC |
| 6 | OUT |
| 7 & 8 | S2 & S3 |
S0 and S1 pins are used in scaling the output frequency. The frequency can be scaled to three different preset values of 2%, 20%, or 100%. This frequency-scaling function allows the sensor to be used with a variety of microcontrollers and other devices. The table below shows the different combinations of S0 and S1 used to obtain different output frequencies.
| S0 | S1 | Maximum Output Frequency | Percentage Scale |
|---|---|---|---|
| LOW | LOW | Power down | Power down |
| LOW | HIGH | 12kHz | 2% |
| HIGH | LOW | 120kHz | 20% |
| HIGH | HIGH | 600kHz | 100% |
S2 and S3 pins are used to select the color of the array. If we want to detect only green color, we can select 16 red-filtered photodiodes by setting the two pins to HIGH according to the table. Similarly, we can choose different types of photodiodes by different combinations of S2 and S3 as shown in the table below.
| S2 | S3 | Photodiode Type |
|---|---|---|
| LOW | LOW | Red |
| LOW | HIGH | Blue |
| HIGH | LOW | No filter |
| HIGH | HIGH | Green |
GND is the ground pin connected to the ground of your power supply. Furthermore, if you are connecting the sensing module with a microcontroller, also connect this pin with the ground terminal of the microcontroller.
Out pin is the TLL level square wave that changes frequency with the amount of light sensed. The specific sensor Red, Green, Blue, or No filter is selected using two digital control inputs (S2 & S3).
The frequency of the square wave is proportional to the amount of light falling on a set of light-detecting diodes. We control which set of diodes is connected to the output using two digital control inputs. So only one set of photodiodes is connected at a time to generate the output.
VCC pin supplies the power to the module. It is connected to the 2.7V to the 5.5V power supply.
OE is the Output Enable pin. This pin is rarely used and on most modules is permanently enabled. If it is not already enabled then pull it LOW.
How TCS230 Color Sensor Works?
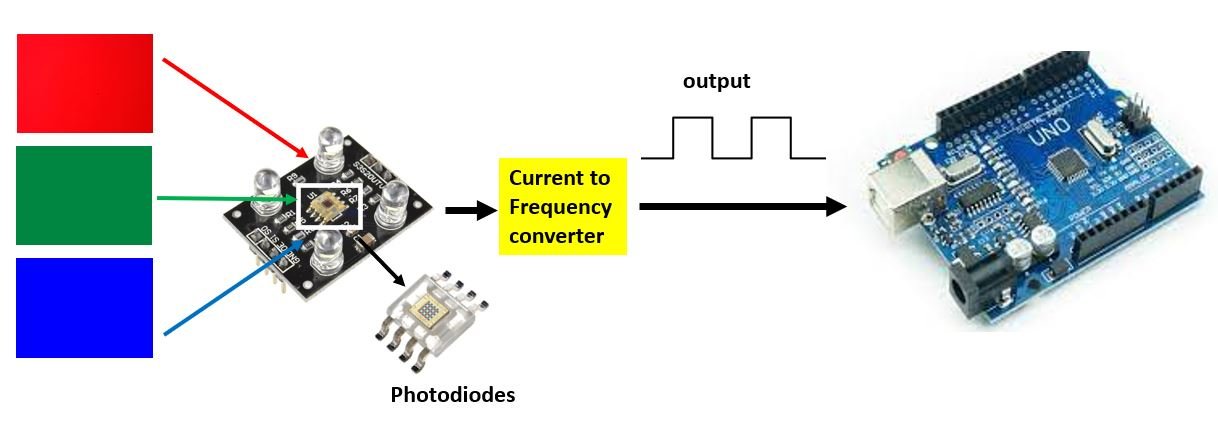
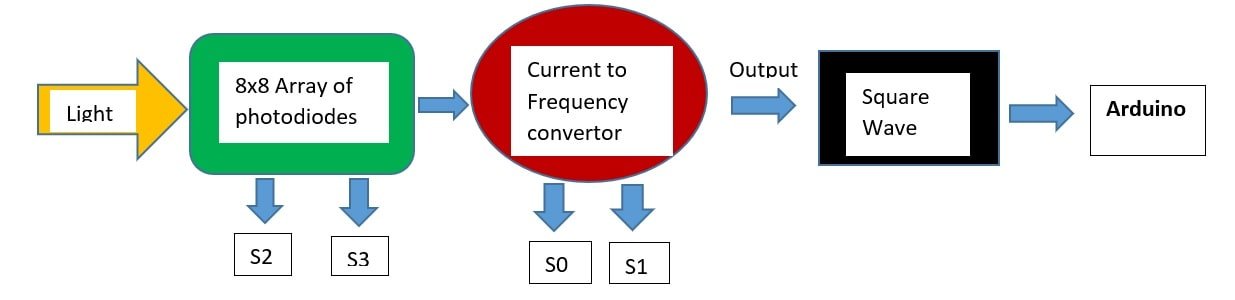
TCS230 sensor works on the principle of light reflection procedure. This sensor mainly consists of an 8*8 array of photodiodes and a current to frequency converter. In this sensor, light is reflected back towards the color sensor therefore this light is sensed by photodiodes. Then this reading of photodiodes is received by a current to frequency converter which converters this reading into a square wave. The frequency of this square wave is directly proportional to the intensity of light and finally, this wave is received by controllers such as a microcontroller or Arduino, etc. which tells the color of that specific thing or object.
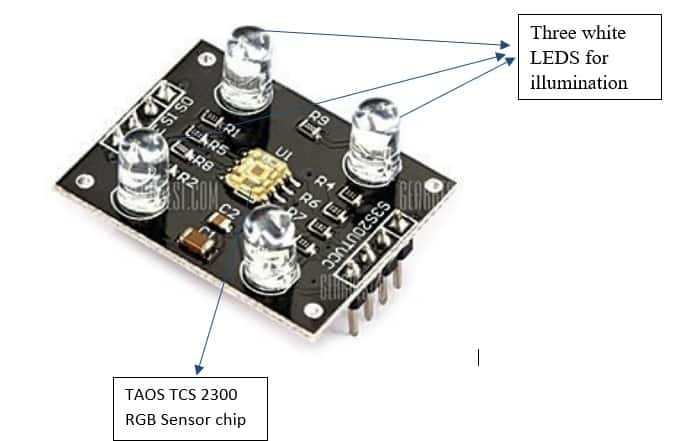
At the center of the color sensing module is an inexpensive RGB sensor chip from Texas Advanced Optoelectronic Solutions – TCS230. The sensor itself can be seen at the center of the module, surrounded by four white LEDs.
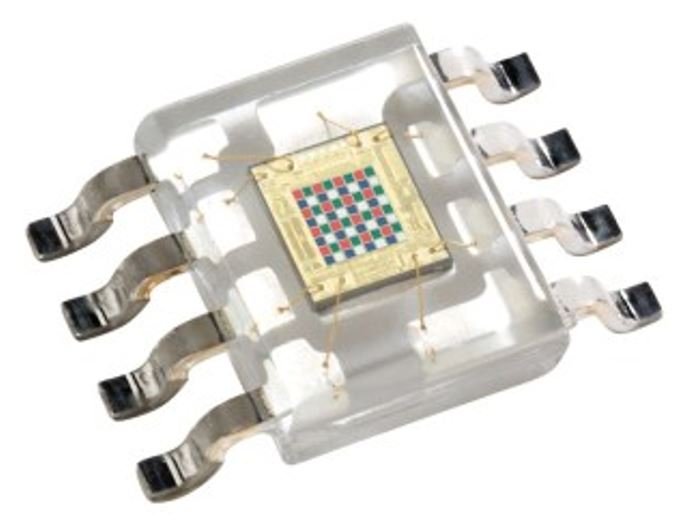
The TCS230 detects color with the help of an 8 x 8 array of photodiodes, which has a total of 64 photodiodes of which 16 photodiodes have red filters, 16 photodiodes have green filters, 16 photodiodes have blue filters, and the remaining 16 photodiodes are clear with no filters. Each 16 photodiode are connected in parallel, so using two control pins S2 and S3 you can choose which of them to read. An internal current-to-frequency converter converts readings from photodiodes into a square wave whose frequency is proportional to the intensity of the chosen color. The range of the typical output frequency is 2HZ to 500KHZ.
The figure below shows the photodiodes present in the TCS230 sensor in a closer manner:
For the selection of these color filters, S2 and S3 pins are used which are selected automatically through the logic program.
The table below shows the different configurations of the S2 and S3 pins required to select the different photodiode:
| S2 | S3 | Photodiode Type |
|---|---|---|
| LOW | LOW | Red |
| LOW | HIGH | Blue |
| HIGH | HIGH | Green |
| HIGH | LOW | No filter |
Interfacing TCS230 Color Senor with Arduino
As we have seen above, the TCS230 module has 8 terminals but we will connect 7 of them with the Arduino board. The Output Enable(OE) pin will not be connected.
As the color sensor requires an operating voltage in the range of 2.7-5.5V hence we will connect the VCC terminal with 5V which will be in common with the Arduino board. The S0, S1, S2, S3, and OUT will be connected with any digital input pins of the Arduino board. We have used GPIO2, GPIO3, GPIO4, GPIO5, and GPIO6 respectively to connect with these 5 pins. You can use any suitable digital pins of the Arduino board. Moreover, the GND pin of the sensor will be connected with the GND of the Arduino.
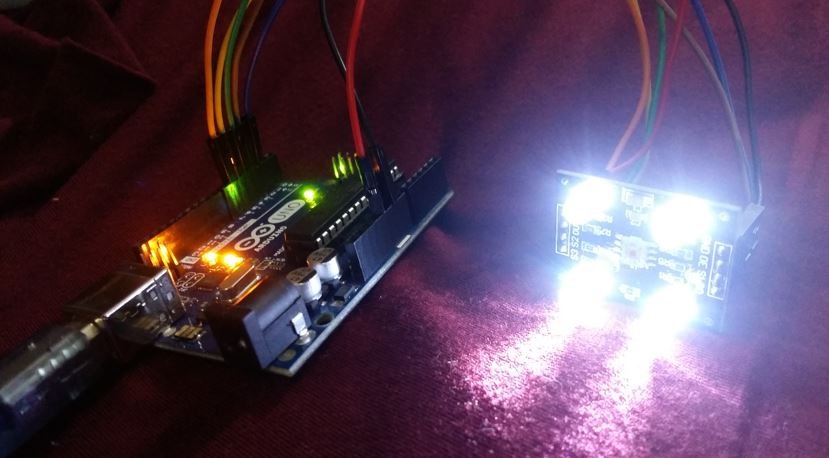
The connections between the two devices can be seen below.


Powered ON
Arduino Sketch 1: Calibrating TCS230 TCS3200 Color Sensor
Open your Arduino IDE and go to File > New. A new file will open. Copy the code given below in that file and save it.
This sketch will help us calibrate our TCS230 color sensor. We will determine the extreme frequency values(maximum and minimum) obtained for each color. This will be achieved by noting the values when the sensor is placed close to the object and when it is placed further away from it. These two values will help us define a range of frequencies which we will use in our next sketch to identify the color of an object.
#define S0 2
#define S1 3
#define S2 4
#define S3 5
#define OUT 6

int RED_freq = 0;
int GREEN_freq = 0;
int BLUE_freq = 0;

void setup() {
  pinMode(S0, OUTPUT);
  pinMode(S1, OUTPUT);
  pinMode(S2, OUTPUT);
  pinMode(S3, OUTPUT);

  pinMode(OUT, INPUT);

  digitalWrite(S0,HIGH);
  digitalWrite(S1,LOW);

  Serial.begin(115200);
}
void loop() {
  digitalWrite(S2,LOW);
  digitalWrite(S3,LOW);
  RED_freq = pulseIn(OUT, LOW);
  Serial.print("R = ");
  Serial.print(RED_freq);
  delay(100);

  digitalWrite(S2,HIGH);
  digitalWrite(S3,HIGH);
  GREEN_freq = pulseIn(OUT, LOW);
  Serial.print(" G = ");
  Serial.print(GREEN_freq);
  delay(100);

  digitalWrite(S2,LOW);
  digitalWrite(S3,HIGH);
  BLUE_freq = pulseIn(OUT, LOW);
  Serial.print(" B = ");
  Serial.println(BLUE_freq);
  delay(100);
}
How the Code Works?
We will first define the five pins: S0, S1, S2, S3, and OUT of the color sensor that we have connected with each of the Arduino UNO’s pins. As mentioned before we have used the digital pins GPIO2, GPIO3, GPIO4, GPIO5, and GPIO6 respectively. Feel free to use any digital pin offered by the Arduino board.
#define S0 2
#define S1 3
#define S2 4
#define S3 5
#define OUT 6
Then we will define three integer variables for each of the color’s frequencies. We are noting frequencies for three colors: red, green and blue. Initially, we have set these variables to 0.
int RED_freq = 0;
int GREEN_freq = 0;
int BLUE_freq = 0;
setup()
Inside the setup() function, we will open the serial communication at a baud rate of 115200.
Serial.begin(115200);Then, by using the pinMode() function we will set the S0, S1, S2 and S3 pins as output pins and the OUT pin as the input pin. The square wave will be obtained at the OUT pin. Whereas the S0 and S1will be used to select the frequency scaling and the S2 and S3 pins will select the color array.
  pinMode(S0, OUTPUT);
  pinMode(S1, OUTPUT);
  pinMode(S2, OUTPUT);
  pinMode(S3, OUTPUT);
  pinMode(OUT, INPUT);
Additionally, we will set the frequency scaling to 20% by setting the S0 pin as HIGH and S1 pin as LOW.
  digitalWrite(S0,HIGH);
  digitalWrite(S1,LOW);
We can use different configurations of S0 and S1 pins to achieve different output frequency scaling. The table below shows them:
| S0 | S1 | Output Frequency Scaling |
|---|---|---|
| LOW | LOW | Power Down |
| LOW | HIGH | 2% |
| HIGH | LOW | 20% |
| HIGH | HIGH | 100% |
For Arduino, we commonly scale the output frequency by 20%.
loop()
Inside the loop() function we will one by one select the appropriate color filter and access the frequencies.
Firstly, we will select the red filter. This is done by setting both the S2 and S3 pins to LOW by using the digitalWrite() function. Next by using the pulseIn() function we will specify the ‘OUT’ pin as the first parameter and ‘LOW’ as the second parameter. This signifies that we want to access the lower frequencies. Then we will display this value in the serial monitor after a delay of every 100 milliseconds.
  digitalWrite(S2,LOW);
  digitalWrite(S3,LOW);
  RED_freq = pulseIn(OUT, LOW);
  Serial.print("R = ");
  Serial.print(RED_freq);
  delay(100);
Secondly, we will select the green filter. This is done by setting both the S2 and S3 pins to HIGH by using the digitalWrite() function. Next by using the pulseIn() function we will specify the ‘OUT’ pin as the first parameter and ‘LOW’ as the second parameter. This signifies that we want to access the lower frequencies. Then we will display this value in the serial monitor after a delay of every 100 milliseconds.
 digitalWrite(S2,HIGH);
 digitalWrite(S3,HIGH);
 GREEN_freq = pulseIn(OUT, LOW);
 Serial.print(" G = ");
 Serial.print(GREEN_freq);
 delay(100);
Thirdly, we will select the blue filter. This is done by setting the S2 pin to LOW and the S3 pin to HIGH by using the digitalWrite() function. Next by using the pulseIn() function we will specify the ‘OUT’ pin as the first parameter and ‘LOW’ as the second parameter. This signifies that we want to access the lower frequencies. Then we will display this value in the serial monitor after a delay of every 100 milliseconds.
  digitalWrite(S2,LOW);
  digitalWrite(S3,HIGH);
  BLUE_freq = pulseIn(OUT, LOW);
  Serial.print(" B = ");
  Serial.println(BLUE_freq);
  delay(100);
Demonstration
To see the demonstration of the above code, upload the code to Arduino. Before uploading the code, make sure to select Arduino UNO from Tools > Board.
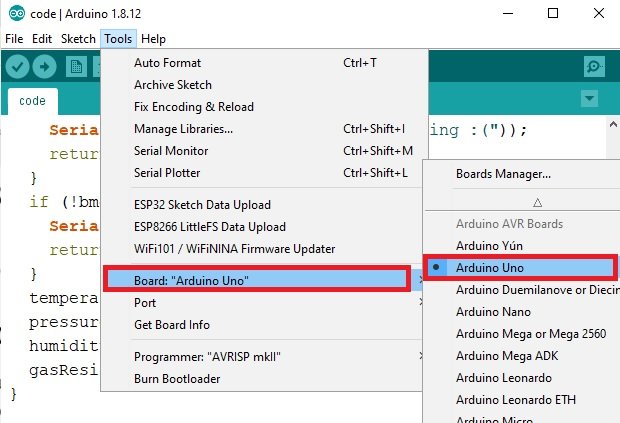
Also, select the correct COM port to which the Arduino board is connected from Tools > Port.
Once the code is uploaded to your board, open your serial monitor and set the baud rate to 115200.
Now place the color sensor in front of a red object.
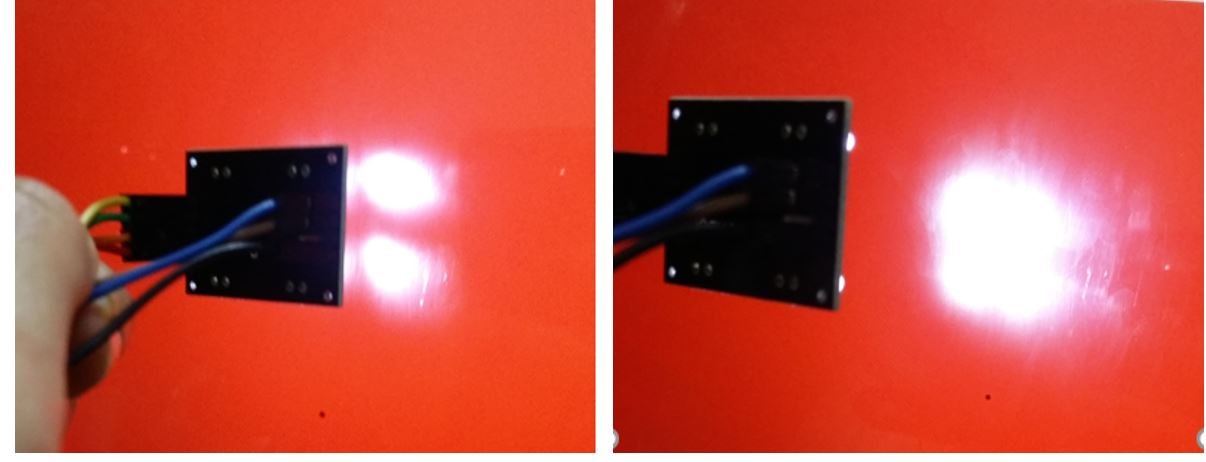
The serial monitor will start displaying RGB values. Place the sensor at varying distances from the object and note down the highest and lowest frequencies for red. Notice that the red frequencies will be lowest in value as compared to blue and green.

Similarly, follow the same procedure with blue and green colors as well. By the end, you will have 6 different frequency values. Two for red: min-max, two for blue: min-max, and two for green: min-max.

Detecting Colors using TCS230 Color Sensor and Arduino
Open your Arduino IDE and go to File > New. A new file will open. Copy the code given below in that file and save it.r
This sketch will identify the three colors red, green, and blue using the TCS230 sensor through the calibrated values obtained from the first sketch. When you will place your color sensor in front of a red, green, or blue object, the serial monitor will be able to identify the color appropriately.
#define S0 2
#define S1 3
#define S2 4
#define S3 5
#define OUT 6

int RED_freq = 0;
int GREEN_freq = 0;
int BLUE_freq = 0;

int red_value = 0;
int green_value = 0;
int blue_value = 0;

void setup() {
  Serial.begin(115200);
  pinMode(S0, OUTPUT);
  pinMode(S1, OUTPUT);
  pinMode(S2, OUTPUT);
  pinMode(S3, OUTPUT);

  pinMode(OUT, INPUT);

  digitalWrite(S0,HIGH);
  digitalWrite(S1,LOW);
}

void loop() {
  digitalWrite(S2,LOW);
  digitalWrite(S3,LOW);
  RED_freq = pulseIn(OUT, LOW);
  red_value = map(RED_freq, 140, 560, 255,0);
  Serial.print("R = ");
  Serial.print(red_value);
  delay(100);

  digitalWrite(S2,HIGH);
  digitalWrite(S3,HIGH);
  GREEN_freq = pulseIn(OUT, LOW);
  green_value = map(GREEN_freq, 215, 480, 255, 0);
  Serial.print(" G = ");
  Serial.print(green_value);
  delay(100);

  digitalWrite(S2,LOW);
  digitalWrite(S3,HIGH);
  BLUE_freq = pulseIn(OUT, LOW);
  blue_value = map(BLUE_freq, 36, 430, 255, 0);
  Serial.print(" B = ");
  Serial.print(blue_value);
  delay(100);

  if(red_value > green_value && red_value > blue_value){
      Serial.println(" RED detected!");
  }
  if(green_value > red_value && green_value > blue_value){
    Serial.println(" GREEN detected!");
  }
  if(blue_value > red_value && blue_value > green_value){
    Serial.println(" BLUE detected!");
  }
}
How the Code Works?
Most of the code is similar to that of the previous sketch. Let us look at relevant parts which are different.
We will define three more integer variables to store the values of the red, green, and blue colors. Initially, we have set them to zero.
int red_value = 0;
int green_value = 0;
int blue_value = 0;
The setup() function is the same as before. We have configured the S0, S1, S2, and S3 pins as outputs and OUT as an input. Additionally, we have set a 20% frequency scaling by setting S0 to HIGH and S1 to LOW.
loop()
Now inside the loop() function, where we accessed each color’s lower frequencies, we will add an additional line of code. This will give us the RGB value for each red, green and blue color. RGB values are in the range 0-255 where 0 denotes the minimum color and 255 denotes the maximum color. Notice that in the first sketch when we obtained the maximum color (sensor closer to the object) the frequency had a minimum value.
We will therefore map the frequencies obtained from the first sketch to obtain the RGB values. This will be achieved by using the map() function. It will take in 5 parameters. The first parameter is the frequency variable for each color. The second parameter is the minimum value obtained for that color from the first sketch. The third parameter is the maximum value obtained for that color from the first sketch. The fourth and fifth parameters are 255 and 0 respectively.
Insert your own maximum and minimum frequency values for each color that you obtained from the first sketch. Remember MIN_FREQ corresponds to the frequency obtained when you place the sensor close to the object and MAX_FREQ corresponds to the frequency obtained when you place the sensor at a distance from the object.
 red_value = map(RED_freq, RED_MIN_FREQ, RED_MAX_FREQ, 255,0);
 green_value = map(GREEN_freq, GREEN_MIN_FREQ, GREEN_MAX_FREQ, 255, 0);
 blue_value = map(BLUE_freq, BLUE_MIN_FREQ, BLUE_MAX_FREQ, 255, 0);
We will save the RGB value for each color in the variables we defined earlier ‘red_value’, ‘green_value’ and ‘blue_value.’ These will be displayed in the serial monitor after a delay of 100 milliseconds.
Additionally, in order to identify these three colors, we will use if statements. Whichever color has a higher RGB value will be the color of the object you place in front of the sensor. This way the color will get detected.
  if(red_value > green_value && red_value > blue_value){
      Serial.println(" RED detected!");
  }
  if(green_value > red_value && green_value > blue_value){
    Serial.println(" GREEN detected!");
  }
  if(blue_value > red_value && blue_value > green_value){
    Serial.println(" BLUE detected!");
}
Demonstration
To see the demonstration of the above code, upload the code to Arduino. Before uploading the code, make sure to select Arduino UNO from Tools > Board.
Also, select the correct COM port to which the Arduino board is connected from Tools > Port.
Once the code is uploaded to your board, open your serial monitor and set the baud rate to 115200. Now place your color sensor in front of a red, green, or blue object. The serial monitor will display the detected color immediately.

Conclusion
In this user guide, we had a look over the TCS230/TCS3200 color sensor and how to use it with Arduino. By using two sketches, first, we were able to calibrate our sensor and then successfully able to identify red, green, and blue objects. Additionally, we can even detect more colors by adding similar code to our sketches.
You may like to read about other popular sensors and modules with Arduino: